Lysine: a case study on Europe's growing dependence on basic chemical imports from China
In recent years, China has taken the lead in the global market, driving down prices in other regions through an aggressive export strategy
Published by Luigi Bidoia. .
Organic Chemicals Price Drivers
Lysine is an essential amino acid for optimizing animal nutrition. In animal feed, it is used as a supplement, particularly for pigs, poultry, and fish. Its use reduces the need for expensive animal proteins (e.g., fishmeal or soybean meal) and decreases the environmental impact by lowering nitrogen levels in animal waste.
Additionally, lysine is used as a supplement in human nutrition and for pharmaceutical production.
In recent years, lysine's importance has grown due to its use in innovative applications, particularly in biotechnology and sustainable chemistry. It is a key raw material for producing biodegradable polymers, which are used in eco-friendly materials, medical devices, and innovative textiles.
Moreover, its production process has undergone a significant transformation: chemical synthesis is being replaced by microbial fermentation, which is more sustainable, cost-effective, and better suited to achieving the purity required for specific applications.
Prices in Europe
In Europe, lysine prices have experienced significant fluctuations in recent years. The graph below shows the average annual lysine prices recorded from economic exchanges across the 27 EU countries.
Average annual lysine prices in Europe
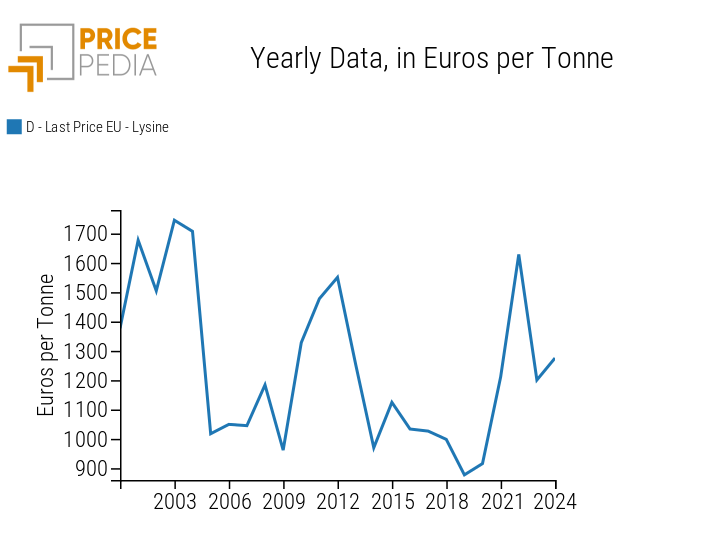
The first significant shift in price levels occurred in 2005, when the price of lysine dropped from over €1,700 per ton to just above €1,000. Between 2010, the year of recovery from the global recession, and the European recession triggered by the sovereign debt crisis of 2011, lysine experienced a wide price cycle. Finally, in the 2021-2022 period, lysine prices rose dramatically, reaching the highs of the early 2000s, before dropping again in the following two years, stabilizing between €1,200 and €1,300 per ton.
China's entry into the international market
Within these price cycles, the most significant event for lysine was the 2005 price collapse, driven by China’s entry into the international markets. Until the early years of this century, Chinese lysine production was confined to the domestic market. Subsequently, the continuous growth of Chinese production capacity, along with the expansion opportunities enabled by China’s entry into the WTO, initiated a period of sustained growth in Chinese exports.
In the graph below, Chinese exports since 1995 are compared with those of the two other major players in the international lysine trade: the United States and the Netherlands.
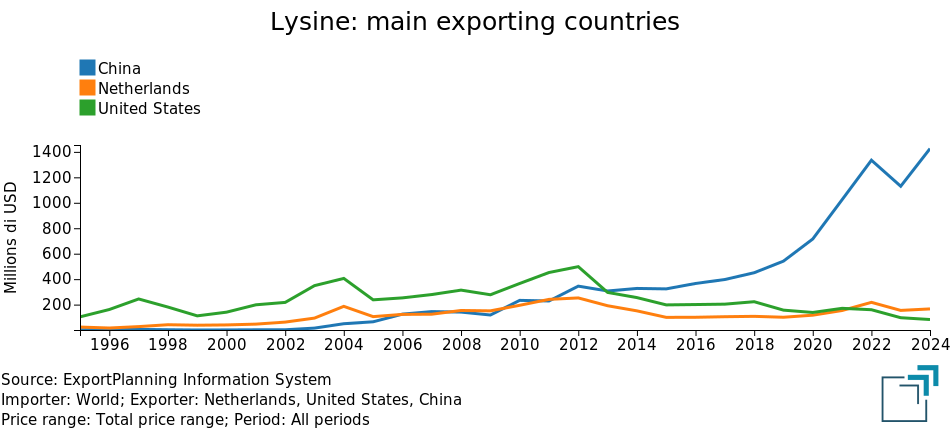
An analysis of the graph shows that China reached the export levels of the Netherlands in 2005 and those of the United States in 2013, before accelerating its growth further until 2022, significantly surpassing the export values of its main competitors. It is estimated that by 2024, Chinese exports could approach $1.4 billion, compared to much lower volumes recorded by the Netherlands and the United States.
There is no doubt that, over the last decade, China has become the undisputed leader in the global lysine market.
China's global leadership has also translated into a rapid penetration of the European market, as illustrated by the graph below.
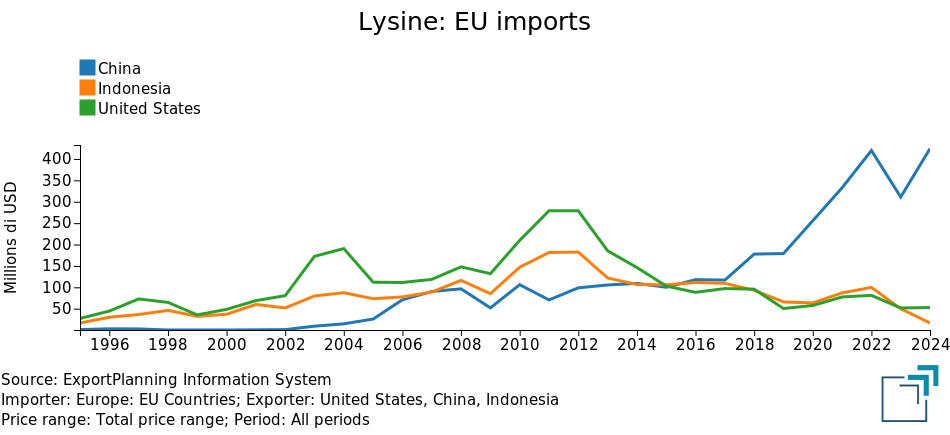
In the first decade of the new century, the main suppliers of lysine to the EU market were the United States and Indonesia. After 2005, China began entering the European market, albeit with lower volumes compared to these two major competitors. During the 2012-2013 crisis, while imports from the United States and Indonesia fell sharply, Chinese imports remained relatively stable, setting the stage for the significant growth that began in 2018. By 2024, imports of lysine from China, exceeding $400 million, dominate the EU market.
Do you want to stay up-to-date on commodity market trends?
Sign up for PricePedia newsletter: it's free!
Prices in China and Europe
In a context where the EU market is dominated by imports from China, it is logical to expect that prices in the European market are largely influenced by Chinese export prices, as evidenced by the graph below.
Comparison of monthly lysine prices in China and Europe
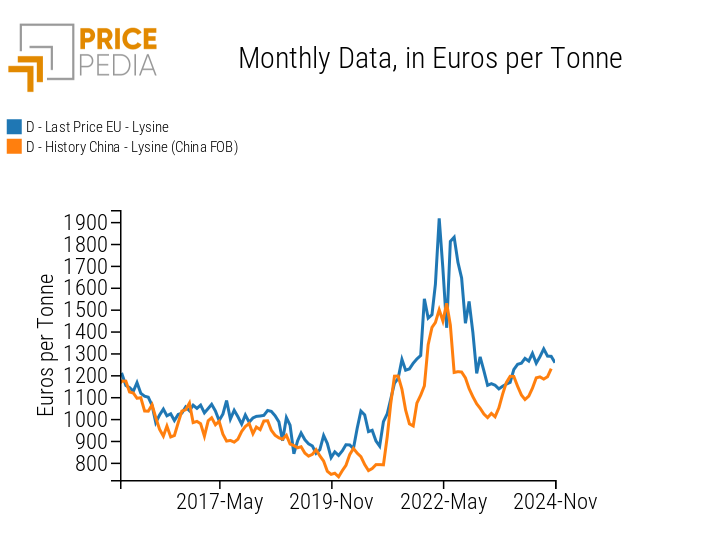
Analysis of the graph shows the dynamics of the two prices are essentially the same, although the average price of lysine exported from China is significantly lower. The Chinese export price then serves as a lower benchmark price on the EU market. This benchmark role is further confirmed by the fact that, since late 2019, the Chinese price tends to anticipate the European price trend.
An Econometric Analysis
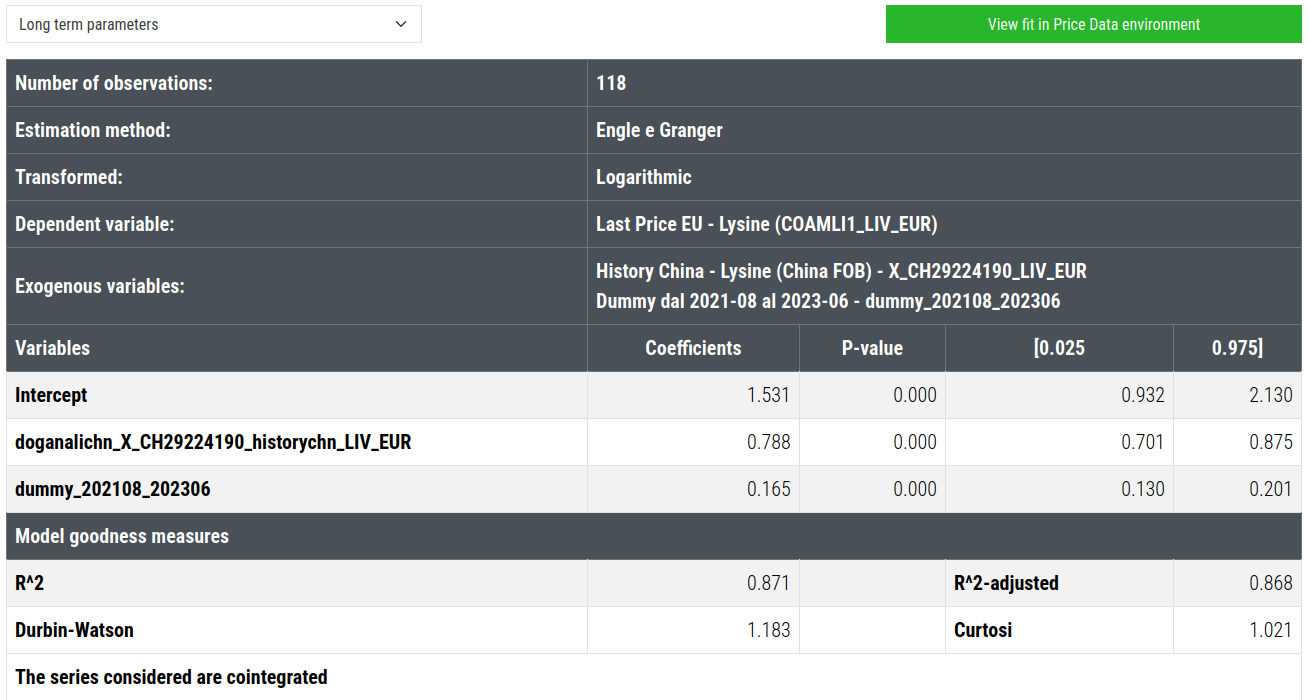
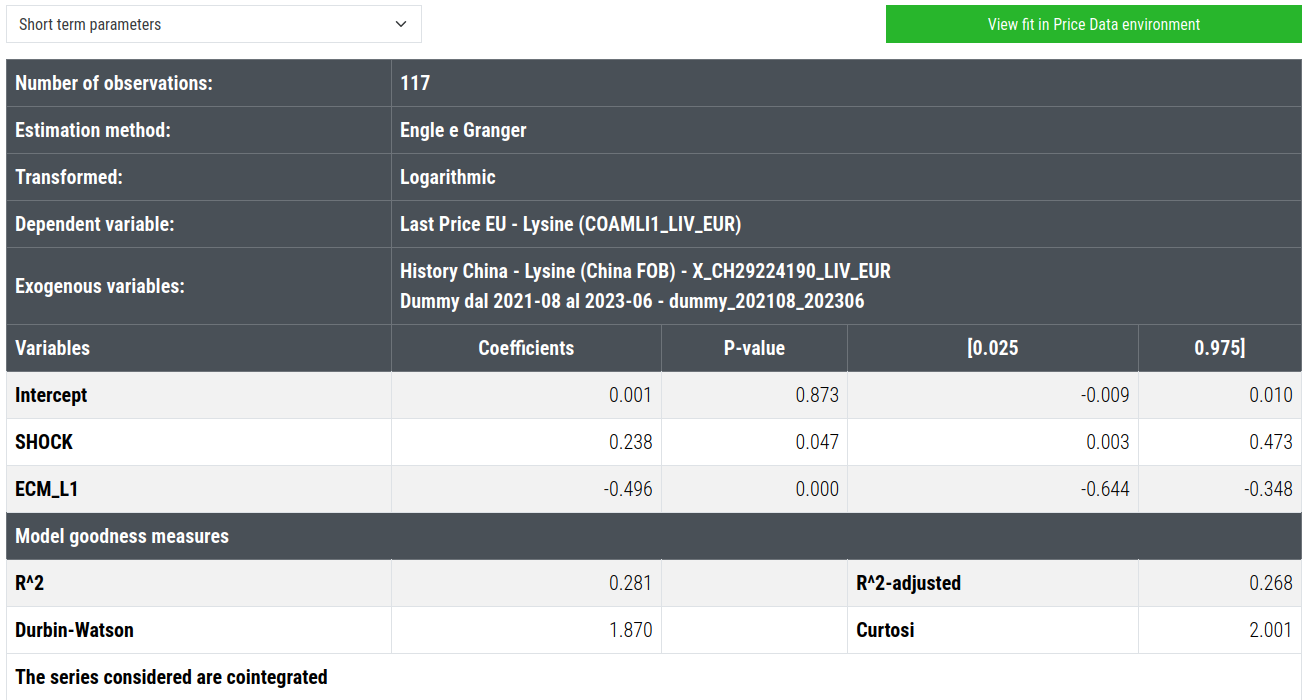
We estimated a model that explains the price of European lysine as a function of the price of Chinese lysine. The objective was to verify, from an econometric perspective, how accurately the Chinese price can account for the European price. The results of the analysis[1] confirm the expectations:
- The price of Chinese lysine largely explains the level and dynamics of European prices;
- The European price tends to align with changes in the Chinese price with a lag of approximately one month.
During the estimation process, a constant dummy variable for the period August 2021 to June 2023 emerged as particularly significant. This dummy helps to explain a European lysine price that, during the indicated period, was significantly higher than the levels determined by Chinese lysine prices. Since these 22 months correspond to a period when natural gas prices on the TTF hub in Europe were significantly higher than LNG prices on the Asian market (JKM: Japan/Korea Marker), it is reasonable to attribute this to higher production costs in Europe for lysine produced via chemical synthesis.
Conclusions
Lysine has historically been a critical product for improving the efficiency and sustainability of pig, poultry, and fish farming. Moreover, it is becoming increasingly important due to its growing use in innovative applications related to biotechnology and sustainable chemistry.
Over the past 20 years, the Chinese lysine industry has experienced significant growth, becoming the undisputed leader in the global market. In this context, European prices closely follow the benchmark set by Chinese prices, with periods of divergence caused by growing differences in production costs between Europe and China.
From various perspectives, lysine serves as a compelling case study to illustrate the increasing importance of Chinese production and exports in the global chemical commodity market. As with many other basic chemical products, Europe depends on imports from China to ensure the availability of essential chemical commodities for its industries.
[1] The model was estimated in two steps using the dynamic specification of Engel and Granger.
The following are the results of the long-run equation.
