Producer Prices in the United States
A representative measure of wholesale prices in the American market
Published by Pasquale Marzano. .
Macroeconomics US Producer Price Analysis tools and methodologiesIn PricePedia, the new US Producer Prices section is now available, providing monthly producer price indices for the United States. Like all other sections, it will be continuously updated, enabling platform users to monitor producer price dynamics in the US and, most importantly, compare different measures of commodity prices observed in various markets at different stages of the distribution chain.
The US Producer Price Index
The Producer Price Index (PPI) for the United States measures wholesale inflation in the country. Published monthly by the US Bureau of Labor Statistics (BLS), the index tracks the average change over time in selling prices reported by American producers of goods and services. Unlike consumer price indices, which assess price changes from the buyer's perspective, the PPI measures price changes from the producer's perspective.
In PricePedia, the US PPI data is organized into two classifications developed by the BLS based on information collected directly from American producers. These are:
- Industry-based classification, which organizes over 300 PPI time series by industrial sector, identified by the North American Industry Classification System (NAICS) code. These PPIs measure price changes reported by producers in a given industrial sector for goods sold outside the sector itself;
- Commodity-based classification, which groups over two thousand products based on their similarity or material composition, regardless of the producing company's industrial classification. This classification does not align with any other standard coding structure.
In general, PPI indices are particularly useful for macroeconomic analysts to forecast overall inflation in the US economy. At the sector and product levels, they are equally valuable for studying commodity price dynamics in the American market and their determinants. Additionally, this tool can be significant when European prices are influenced by trends in the US market.
Comparing US and EU industries
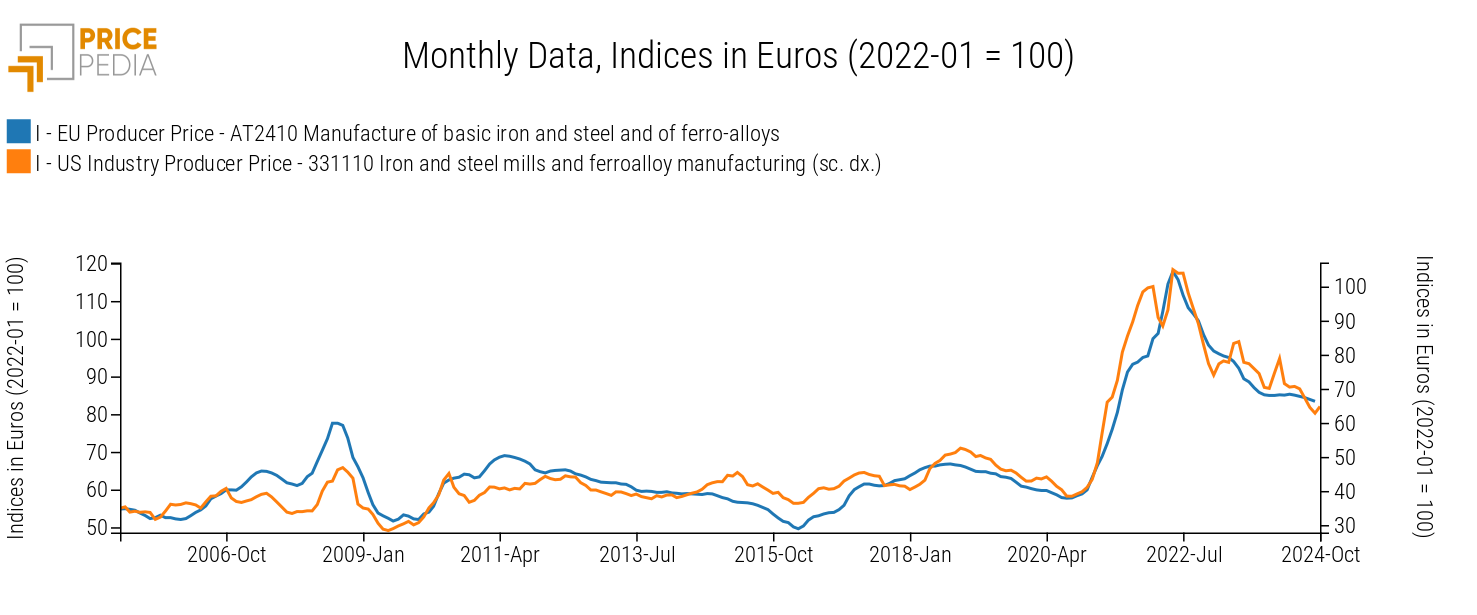
The inclusion of US PPIs in PricePedia allows for a comparison of producer prices across major industrial sectors on both sides of the Atlantic. The following chart compares producer prices in the EU and the United States (right scale) for the steel industry, both expressed as indices in euros, with January 2022 as the base period.

Over the long term, the two series show a common trend, as evidenced by their high correlation of 0.94, with smaller or bigger differences depending on the periods:
for instance, between 2006 and 2008, prices in Europe grew more than their US counterparts. During the 2021-2022 price growth cycle, a sharp increase in prices was observed in both regions. However, the growth was significantly greater in the US, where prices more than doubled compared to 2020 levels, while in Europe, the increase was strong but less pronounced.
Factors contributing to the difference in price growth rates between the US and European markets include protectionist measures in the two regions (for more details, see the article Protectionist policies: the case of steel tariffs) and lower competition in the US market during periods of high demand.
Comparing Prices from Different Sources
US PPI vs. Financial Prices
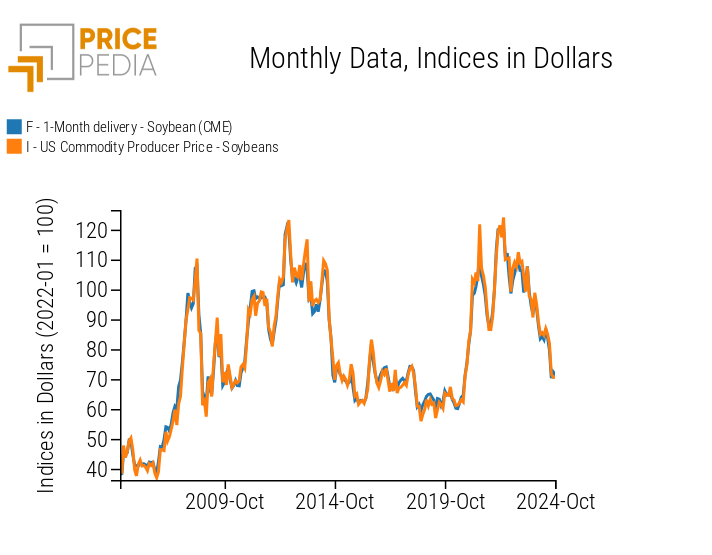
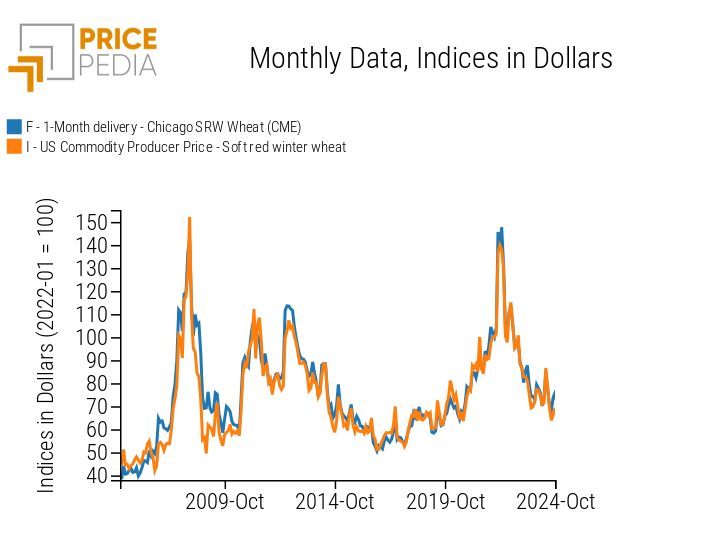
The representativeness of US PPIs can be assessed by comparing them with financial quotations for contracts of the same products traded on the Chicago Mercantile Exchange (CME). Two illustrative cases are soybeans and soft red winter (SRW) wheat, of which the United States is one of the world's largest producers.
Do you want to stay up-to-date on commodity market trends?
Sign up for PricePedia newsletter: it's free!
Below the charts comparing prices for the two products from the two different sources are shown. In both charts, dollar-denominated quotations are represented as indices, with January 2022 as the base period.
Soybeans

Soft Red Winter Wheat

For both soybeans and wheat, prices reported by American producers and CME financial prices are nearly identical.
US PPI vs. EU Customs Prices
The representativeness of US PPIs also enables comparisons with European prices, especially for products without a financial market reference.
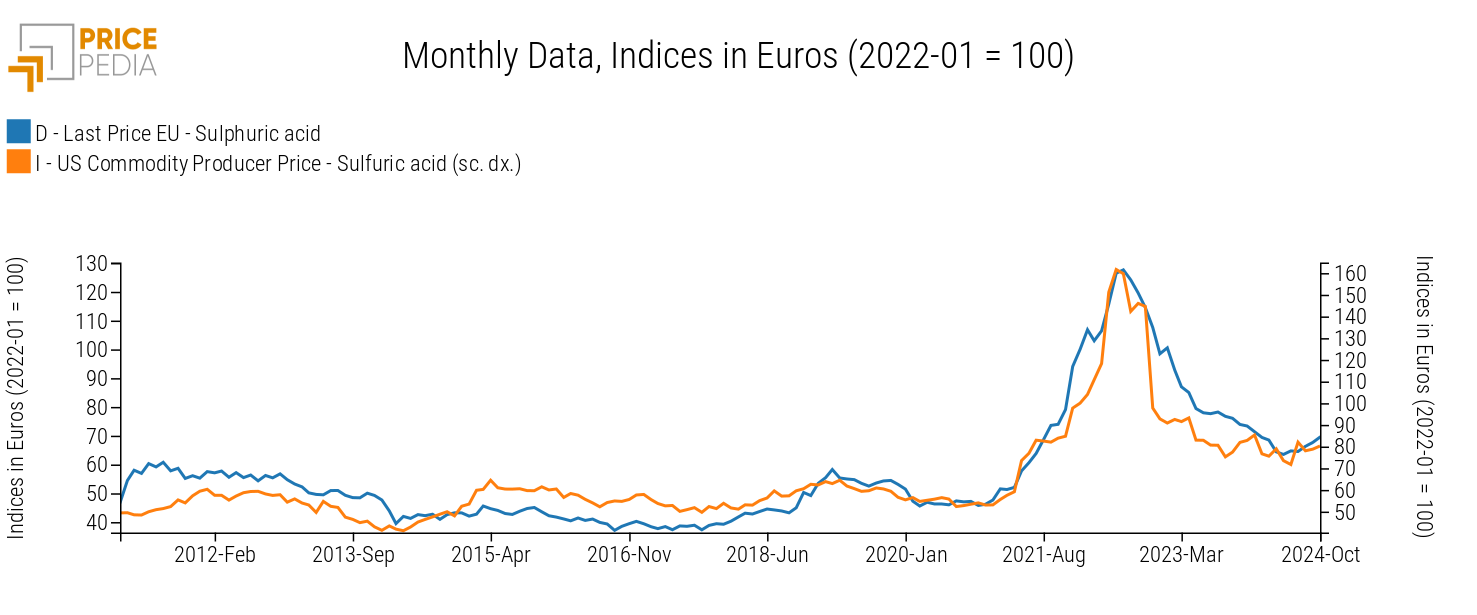
An example is shown in the following chart, comparing the EU customs price of sulfuric acid with the corresponding US producer price (right scale), both expressed in euros (index with January 2022 as the base period).

Despite minor short-term differences, it is also evident that the two prices follow a common dynamic, as reflected by their high correlation of 0.93.
Conclusions
The new US Producer Prices section complements the price information already available in PricePedia with new measures and calculation methodologies. These indicators provide a valuable tool for analyzing and monitoring raw material prices in the US market, offering insights that may help anticipate trends in the European market for products where the United States is a major global supplier.


