Benzene Prices: Equilibrium Mechanisms and Market Dynamics
How market forces balance the differential between benzene from petroleum and that from tar
Published by Riccardo Pondini. .
Petrolchimica Price DriversIn the article Price of Benzene: Global and Mainly Demand-Driven, an analysis was developed on the market mechanisms that contribute to determining the price of benzene, an important chemical intermediate. The main findings of that analysis were:
- The benzene market is global, with mechanisms capable of determining a single price worldwide month by month;
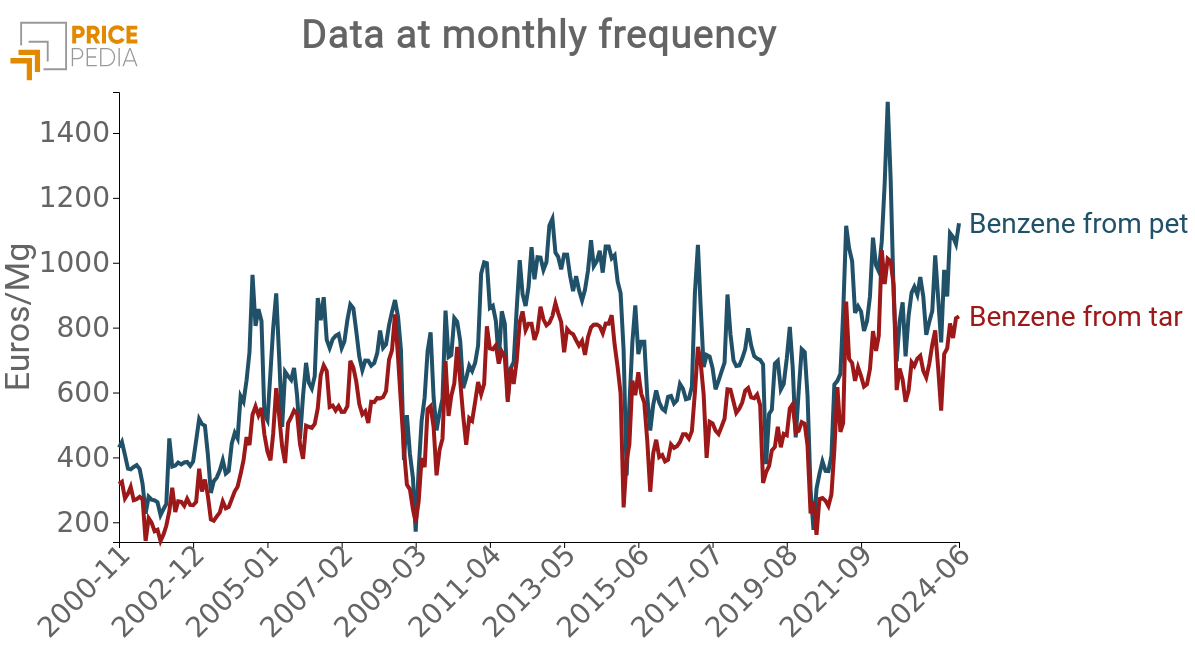
- The dynamics of the benzene price do not depend on the technology used or its specific production costs. The prices of petroleum-based benzene and tar-based benzene are in fact perfectly aligned, with a slight premium price for the former. This alignment is maintained even in the presence of a divergence in their relative costs. In economic terms, the two prices behave like strong substitutes;
- Demand is the main determinant of the price of benzene. Supply, in fact, is relatively inelastic in relation to prices. Increases (or decreases) in prices do not result in significant increases (or reductions) in supply. Since benzene is derived from the transformation of chemical compounds obtained as by-products of various chemical processes, its supply depends more on choices about the production levels of other products.
This article delves into the second point, analyzing the market mechanisms that continuously balance the price of petroleum-derived benzene with that obtained from tar. After analyzing the differential between the two prices, we will introduce a simple cost equation that will form the basis for deriving a dynamic specification with continuous price adjustments, so as to keep the differential between the two benzene prices in balance.
Analysis of the Price Differential between Benzenes
A distinctive feature of benzene is the strong interdependence between the two price series: that of petroleum-based benzene and that of tar-based benzene. The two prices, in fact, never deviate significantly from each other, maintaining a constant differential. This differential is justified both by the production process of the two types of benzene and by their different uses. Petroleum-based benzene, in fact, is purer compared to that from tar, and this purity makes it particularly suitable for a wider range of industrial applications. These uses require higher purity standards to avoid contamination and ensure the effectiveness of the final product.
In light of these considerations, it is clear that petroleum-based benzene is the real driver of the single price, being used in more advanced production processes and produced in greater quantities.
In the past, on the other hand, tar was one of the main sources of benzene. However, with the increase in demand for benzene derivatives and the need for higher production volumes, petroleum-based production has become predominant.
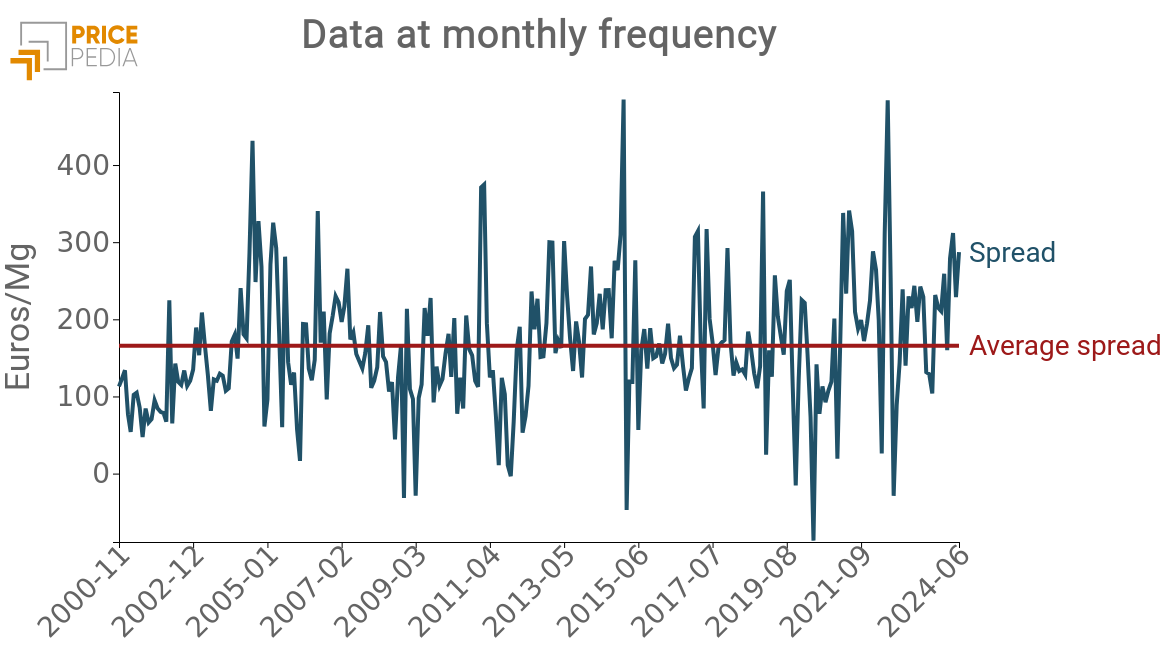
Below is a comparison of the two benzene prices, while the next graph shows their differential.
Historical Series: Price of Petroleum Benzene and Tar

Historical Series: Spread between the two Benzene Prices

The graph related to the differential highlights how it always tends to quickly return to its average, even in the presence of strong fluctuations.
Do you want to stay up-to-date on commodity market trends?
Sign up for PricePedia newsletter: it's free!
Cost Models
The first econometric analysis was conducted considering as dependent variables the prices of the two types of benzene and, as regressors, the prices of the main inputs used in their production. The prices of the two different inputs can be considered proxies for their distinct production costs.
| Variables | Coef | Std Err | t | P[>|t|] | [0.025 | 0.975] |
|---|---|---|---|---|---|---|
| const | 3.4905 | 0.129 | 26.972 | 0.000 | 3.236 | 3.745 |
| LOG_PETROLEUM | 0.7582 | 0.032 | 23.357 | 0.000 | 0.694 | 0.822 |
| R-squared: 0.661, Durbin-Watson: 0.595 | ||||||
| Variables | Coef | Std Err | t | P[>|t|] | [0.025 | 0.975] |
|---|---|---|---|---|---|---|
| const | 3.3163 | 0.208 | 15.926 | 0.000 | 2.906 | 3.726 |
| LOG_TAR | 0.5378 | 0.038 | 13.989 | 0.000 | 0.462 | 0.613 |
| R-squared: 0.411, Durbin-Watson: 0.281 | ||||||
In this specific case, a logarithmic transformation was applied to the variables in order to interpret the regression coefficients as elasticity with respect to costs. The results show that the prices of raw materials are both highly significant, with elasticities of 0.76 and 0.54 respectively for the price of petroleum-based benzene and tar-based benzene. This means that a 10% increase in the price of the two inputs will result in a 7.6% increase in the price of petroleum-based benzene and a 5.4% increase in the price of tar-based benzene.
From the perspective of the statistical quality of the estimates, the models show autocorrelation in the residuals, as evidenced by a weak Durbin-Watson statistic. However, the next step will be to consider both the dynamic model and the interdependence between the two prices, thus improving the adaptive capacity of the cost models to the data analyzed.
Error Correction Models
With the goal of exploring the interdependence between the two prices, we used the approach of error correction models. In particular, these models study and estimate from the data the speed with which the dependent variable adjusts to a misalignment from the long-term equilibrium it shares with the independent variables of the model.
For this purpose, an error correction model (ECM) specification was considered. The specification of this model includes a dynamic part, where the variation in benzene prices is a function of cost variations (disturbance component), and a part represented by an error correction term, consisting of the differential between the two prices delayed by one period. To assess the robustness of this differential, a Beta parameter was considered that relates the level of the two prices.
The error correction term is also multiplied by an Alpha coefficient (less than 0), representing the speed with which the dependent variable adjusts towards equilibrium.
Below are the specifications of the two equations and the estimation results.
ECM Model Specifications

| Variables | Coef | Std Err | t | P[>|t|] | [0.025 | 0.975] |
|---|---|---|---|---|---|---|
| const | 19.2842 | 14.188 | 1.359 | 0.175 | -8.646 | 47.214 |
| BENZENE_TAR_L1 | -0.4554 | 0.0683 | -6.676 | 0.000 | -0.589 | -0.322 |
| BENZENE_PET_L1 | 0.3226 | 0.055 | 5.839 | 0.000 | 0.214 | 0.431 |
| TAR_DIFF | 0.6158 | 0.200 | 3.080 | 0.002 | 0.222 | 1.009 |
| R-squared: 0.172, Durbin-Watson: 1.801 | ||||||
| Variables | Coef | Std Err | t | P[>|t|] | [0.025 | 0.975] |
|---|---|---|---|---|---|---|
| const | 71.4246 | 18.844 | 3.790 | 0.000 | 34.330 | 108.519 |
| BENZENE_PET_L1 | -0.3971 | 0.073 | -5.424 | 0.000 | -0.541 | -0.253 |
| BENZENE_TAR_L1 | 0.3891 | 0.083 | 4.427 | 0.000 | 0.226 | 0.562 |
| PETROLEUM_DIFF | 7.5291 | 1.312 | 5.739 | 0.000 | 4.947 | 10.111 |
| R-squared: 0.197, Durbin-Watson: 1.840 | ||||||
The estimated adjustment speeds are -0.46 for tar-based benzene and -0.40 for petroleum-based benzene. These two parameters are highly significant, which implies that both variables tend to seek long-term equilibrium. The speed represented by these coefficients is relatively high: to close 70% of the gap caused by a shock to the equilibrium, the two variables would take about two months. This result strongly supports the hypothesis of a single benzene price.
Another interesting aspect emerging from the models regards the long-term parameters.
| α | −αβ | β | |
|---|---|---|---|
| BENZENE_TAR | -0.4554 | 0.3226 | 0.7083 |
| BENZENE_PET | -0.3971 | 0.3889 | 0.9794 |
The long-term Beta parameter, equal to 0.71 for petroleum-derived benzene relative to that obtained from tar, is consistent with the price differential discussed earlier. This difference is attributable to the inferior chemical quality of tar-based benzene, which maintains a consistent gap in the long term compared to its counterpart.
Both parameters confirm that the differential analyzed at the beginning of the article is indeed stationary and tends to stabilize around a predictable average.
Conclusions
The analysis conducted on the prices of benzene derived from coal coking and petroleum cracking processes reveals a robust correlation and a tendency to long-term stationarity, suggesting substantial stability and predictability of prices. The price difference between petroleum-based benzene and tar-based benzene reflects the superior quality of the former, justifying its higher price and preference for industrial applications.
The error correction model applied has highlighted a rapid adjustment of the variables towards equilibrium post-shock, confirming the hypothesis of a unified market price for benzene. These results not only enrich our understanding of market dynamics between the two types of benzene but also provide crucial data for buyers who require informed purchasing strategies.


