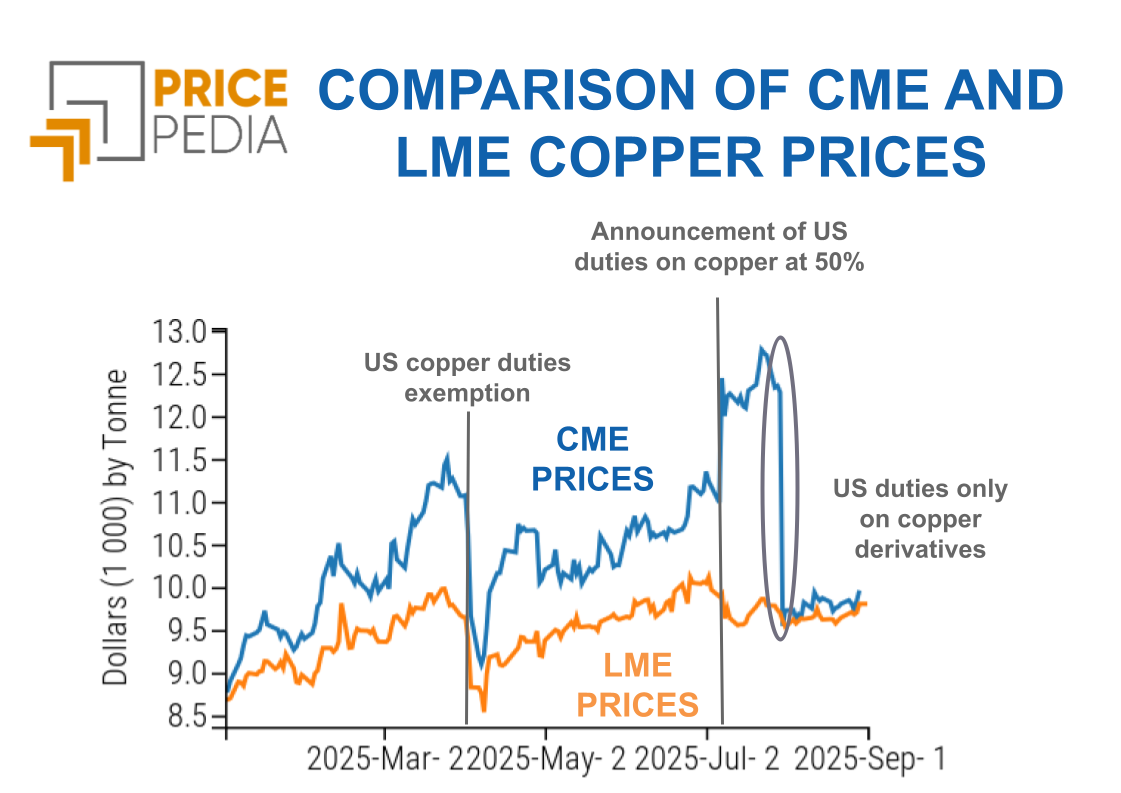
Prices along the copper supply chain: almost always global
Published by Luigi Bidoia. .
Copper Price DriversThe copper supply chain has a unique characteristic within the global commodities and derivatives market: prices on physical markets worldwide for products in the supply chain are closely tied to the financial quotations of cathodes.
Copper cathodes with a purity grade of 99.99% are listed on three major financial markets: the London Metal Exchange (LME), the Chicago Mercantile Exchange (CME), and the Shanghai Futures Exchange (SHFE). In all three financial markets, price levels are essentially equivalent (considering SHFE prices net of the 15% VAT and taxes). The physical prices of pure copper in these three markets perfectly align with the financial prices, resulting in a unified global price for pure copper.
The table below shows the average prices of 99.99% pure copper in the three main global regions for the period from January 2015 to October 2024. All prices are expressed in euros per ton for easy comparison.
Global Pure Copper Prices: Average Jan. 2015 - Oct. 2024 (€/ton)
| Market Type | Market Region | ||
|---|---|---|---|
| European Union | China | United States | |
| Financial | 6323 | 6336 | 6339 |
| Customs CIF | 6438 | 6411 | |
| Customs FOB | 6371 | ||
| Customs Average CIF and FOB | 6385 | ||
As shown in the table, over the past 15 years, the price of pure copper has been uniform both globally and across financial and physical markets.
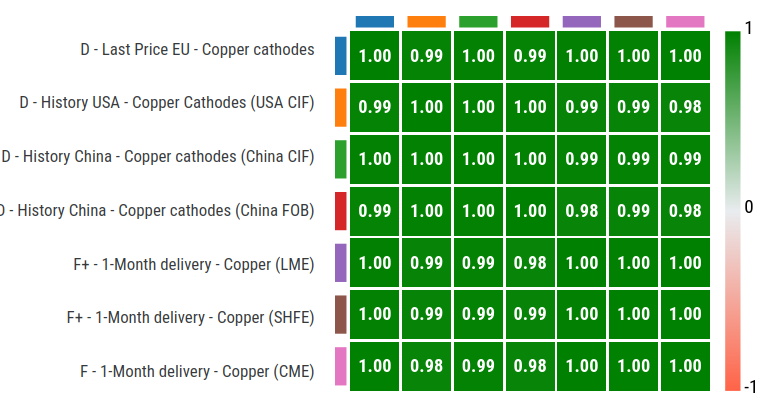
The following figure shows the correlation matrix calculated for the period between January 2015 and October 2024, based on the various monthly prices considered. The strong relationship between the prices is evident: often, the correlation between two prices is equal to 1, implying that, statistically, the two prices can be considered equivalent, apart from a constant. In many other cases, the correlation is 0.99, and only rarely does it drop to 0.98—a value that remains very high, indicating strong alignment among the analyzed prices.
Correlation Matrix of Copper Cathode Prices

Copper Ore and Scrap Prices
The existence of a unified global market for pure copper is also reflected in a substantial homogeneity in the prices of copper ores and scrap. Price differences are mainly due to the varying composition of the ores and the qualitative differences between the various types of scrap.
The table below presents the average prices, for the period from January 2015 to October 2024, of copper ores and certain types of scrap recorded at the customs of the United States, China, and the European Union.
Global Copper Ore and Scrap Prices: Average Jan. 2015 - Oct. 2024 (€/ton)
| Product | USA CIF | USA FOB | EU (Average CIF-FOB) | China CIF |
|---|---|---|---|---|
| Ores | 1514 | 1622 | ||
| Scrap: | ||||
| Spent anodes: copper < 94%, lead < 0.3% | 4829 | |||
| Spent anodes: copper < 94%, lead > 0.3% | 4030 | |||
| Wires | 5742 | 5162 | ||
| Other scrap | 4794 | 4963 |
As highlighted in the table, the price difference for copper ores imported by the EU and China is limited to a single-digit percentage. This gap is particularly narrow when considering the variety of available copper ores, which are characterized by differing copper content percentages. The correlation between ore prices in the two regions is very high, at 0.96, confirming strong alignment between the market values of imported ores.
Similarly, the differences in prices among various types of copper scrap are minimal, especially when considering the characteristics of the copper recoverable from them. Scrap with the highest prices consists of wires, which can be reused for electrical copper production. Conversely, scrap with the lowest prices comes from spent anodes containing a significant amount of lead. This restricts their use to applications where the lead content does not pose a problem, such as certain alloys or uses that are not critical for environmental or health concerns.
The correlations between the prices of different scrap categories are generally high, almost always exceeding 0.90.
Copper Pipe Prices
The table below presents the average prices of copper pipes recorded at the customs of the United States, the European Union, and China. The customs statistics of the three regions classify imported and exported pipes differently: U.S. statistics distinguish between welded and unwelded pipes; European statistics classify pipes as straight or curved; while Chinese statistics categorize them by diameter. All prices are expressed in euros per ton for ease of comparison.
Global Copper Pipe Prices: Average Jan. 2015 - Oct. 2024 (€/ton)
| USA | EU | CHINA | ||||||
|---|---|---|---|---|---|---|---|---|
| CIF | FOB | (Average CIF-FOB) | FOB | |||||
| Unwelded | 8173 | 8849 | Straight | 7691 | Diameter < 25mm | 7268 | ||
| Unwelded (d >6mm) | 7576 | Curved | 7803 | D. < 25mm, threaded | 7273 | |||
| Welded (d >6mm) | 9055 | Diameter > 25mm | 7673 | |||||
The data analysis reveals that Chinese prices are generally lower, with a minimal difference compared to EU prices and a more significant gap relative to U.S. prices. U.S. prices, in particular, record the highest values, exceeding €9,000/ton for welded pipes with a diameter greater than 6 millimeters intended for export.
Prices of Copper Wires
The following table presents the average prices of copper wires recorded at the customs of the United States, the European Union, and China for the period from January 2015 to October 2024. The prices are divided into two categories:
- Refined copper wires: made of 99.99% pure copper, these are generic raw materials used as inputs for further industrial processes.
- Winding copper wires: conductive wires made of copper, specifically designed for use in windings of electric motors, transformers, coils, and other electromagnetic devices.
Prices of Copper Wires Worldwide: Average Jan. 2015 - Oct. 2024 (€/ton)
| Products | USA | EU | China | ||
|---|---|---|---|---|---|
| CIF | FOB | (avg. CIF-FOB) | CIF | FOB | |
| Refined copper wires: | |||||
| diameter < 0.5 mm | 7173 | 7901 | 7903 | ||
| diameter 0.5-6.0 mm | 6620 | ||||
| diameter > 6.0 mm | 6643 | 6792 | 6542 | 6462 | 6620 |
| Winding wires: | |||||
| enameled | 7223 | ||||
| non-enameled | 7514 | ||||
The analysis of this data highlights a strong uniformity in prices across the three regions for refined copper wires with a diameter greater than 6 millimeters. Price differences are minimal, with slightly higher prices observed in the United States. The price correlation matrix for these copper wires shows very high values, all equal to or greater than 0.97. Once again, it can be stated that market mechanisms establish a single global price on a monthly basis.
Conclusions
The analysis of the various prices along the copper supply chain, from ores to wires and pipes, highlights the presence of market forces capable of establishing a single global price for each product on a monthly basis.
Any price differences for a given product across regions, which are always minimal, can be attributed to specific product characteristics. In the U.S. market, prices tend to be slightly higher compared to those in the EU and China.


