Ammonia in the global market: trade and price dynamics
An analysis of major exporting, importing countries and the forces influencing prices, from natural gas to political and competitive dynamics.
Published by Emanuele Altobel. .
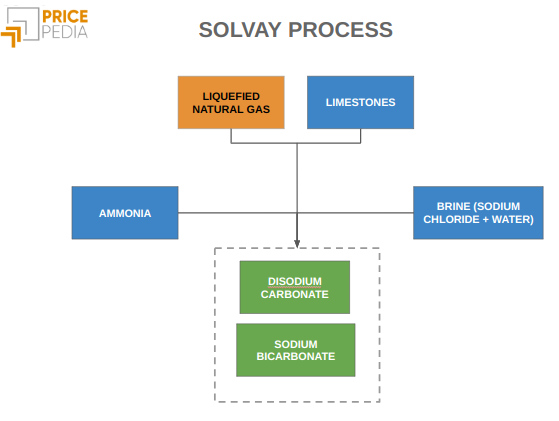
Inorganic Chemicals Price DriversAmmonia, with chemical formula NH3, is a nitrogen compound of extraordinary importance in the chemical industry and numerous other sectors. Because of its versatility, it is a key element in manufacturing processes ranging from the Solvay process to the production of amino acids, via applications in the paper, rubber, metallurgical and detergent industries. However, the two main uses of ammonia involve the production of nitric acid, a strong and highly reactive acid used in multiple industries, and the manufacture of fertilizers such as urea. The latter sector, mainly related to agriculture, accounts for about 70 percent of global ammonia demand.
Ammonia is produced mainly through the Haber-Bosch process, which involves combining nitrogen in the air with hydrogen. Hydrogen, in turn, can be obtained from several sources, shown in the table below.
| Method | Source | CO2 emissions | Sustainability |
| Methane reforming (SMR) | Natural gas (CH4) | High | Not sustainable |
| Water electrolysis | Water + electricity | Zero (if green energy) | Sustainable (green hydrogen) |
| Coal gasification | Coal/biomass | High | Depends on CO2 capture |
| Methane pyrolysis | Methane (CH4) | Low | Potentially sustainable |
| Biological processes | Biomass/algae | Low | Sustainable, but limited |
| Solar photoelectrolysis | Water + sunlight | Zero | Sustainable, experimental |
Currently, the most efficient method of obtaining hydrogen to produce ammonia is methane reforming, a technology that favors natural gas producers. This makes the global ammonia market heavily influenced by countries rich in this natural resource, which dominate exports.
Main exporting countries
Major ammonia exporters include the Middle East and North Africa (MENA) countries, Trinidad and Tobago, Indonesia, Canada, the United States, and Russia. The following graph shows the dynamics of these countries' quantity exports over the past 30 years.
Major exporters of ammonia in the world
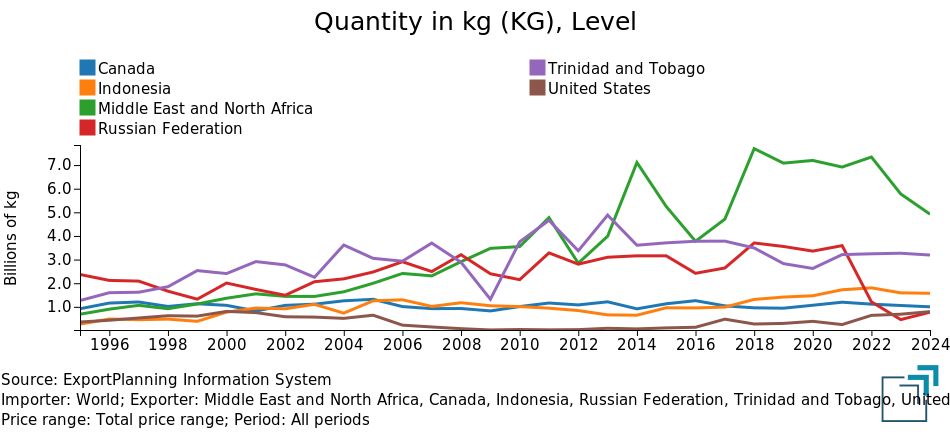
The chart shows that the main exporters of ammonia are currently the countries of the Middle East and Trinidad and Tobago, an island in Latin America that is particularly rich in natural gas.
Russia, on the other hand, is experiencing a decline in its role as a global supplier, following the invasion of Ukraine and the sanctions that followed.
the United States shows an opposite trend, with a slow but steady increase in exports, thanks to growing domestic production.
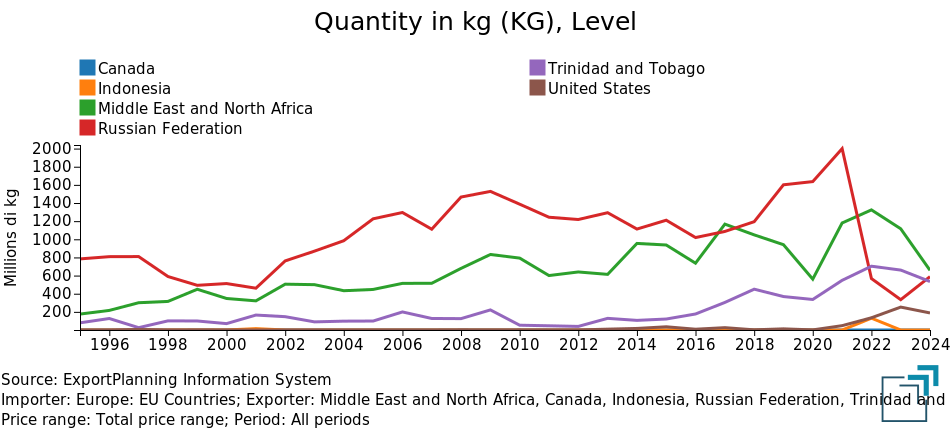
The European Union, not shown in the graph, is a net importer, with much of its trade occurring intra-EU .
Main importing countries
As for the main consuming and importing countries of ammonia, the European Union, the United States, China, India, Morocco and South Korea stand out.
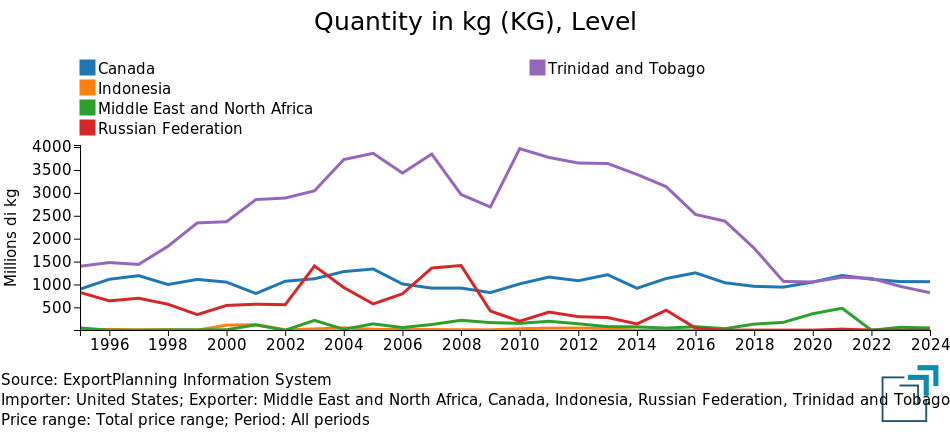
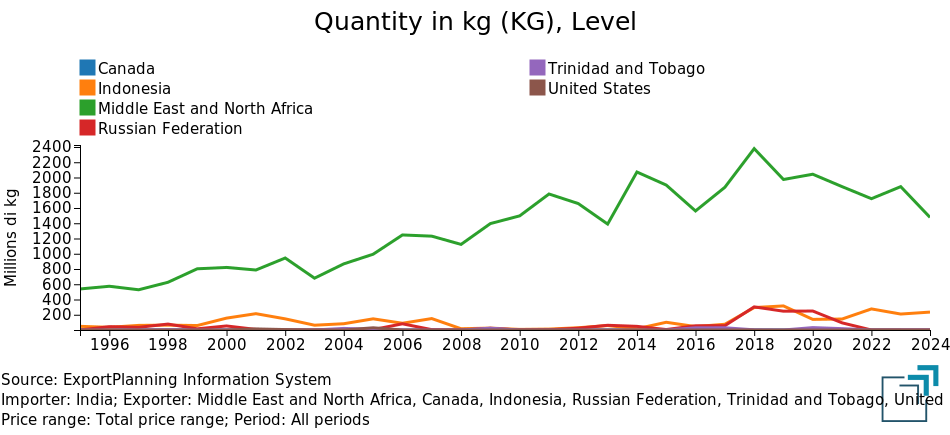
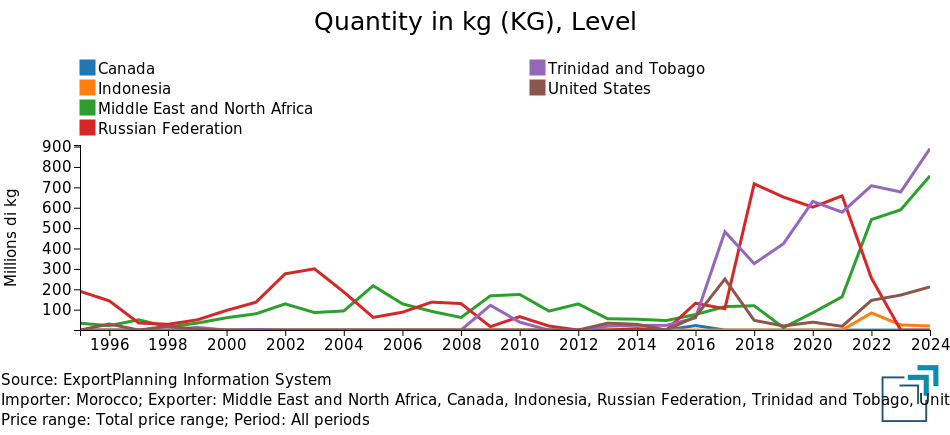
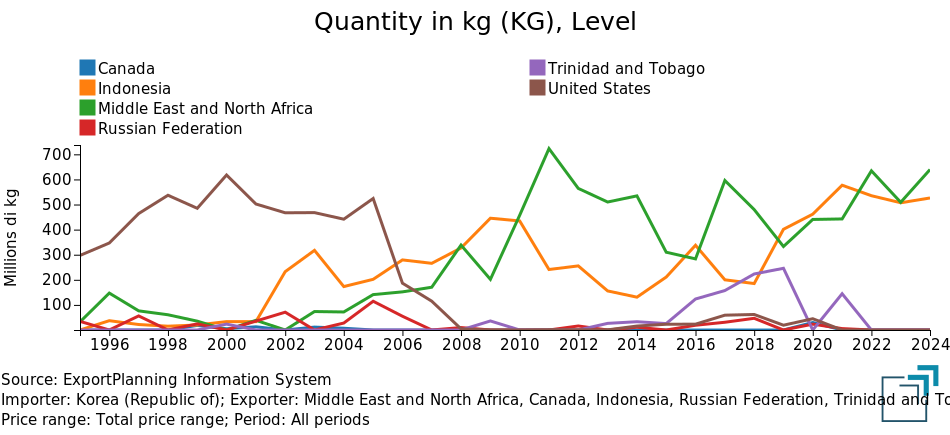
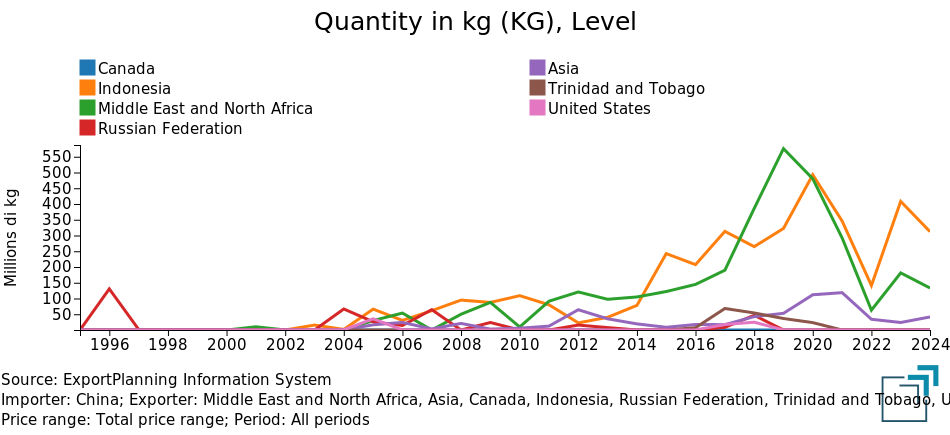
The following is the evolution of imports in the main consuming countries, highlighting the demand dynamics in global ammonia markets and the origin of imports.
Main exporters to US | Main exporters to India |
 |
 |
Main exporters to Morocco | Main exporters to South Korea |
 |  |
Main exporters to EU | Main exporters to China |
 |  |
India and Morocco stand out among the largest importers of ammonia for similar reasons: Morocco, due to its wealth of phosphates, is a major producer of fertilizer for agriculture, a sector for which ammonia is essential.
India, whose economy is strongly tied to agriculture, uses ammonia to support this vital activity.
South Korea, on the other hand, is a major importer for reasons related to the energy transition: the country aims to develop a supply chain based on ammonia and hydrogen for clean energy, with a focus on blue ammonia (produced with carbon capture and storage, CCS, technologies) and green ammonia (obtained through electrolysis powered by renewable energy), to minimize CO2 emissions.
China, faced with high ammonia prices in the 2021-2023 period, significantly reduced imports, mainly for domestic political reasons: the country aimed to produce urea cheaply, but the high cost of ammonia forced a decrease in foreign purchases.
In the United States, ammonia imports have been declining for several years, thanks to increased domestic production given by fracking gas extraction, which has increased its availability. At the same time, there has been an increase in ammonia exports, facilitated by the increased availability of the feedstock domestically.
The long-term reduction in imports by the United States, coupled with the cyclical decline in Chinese imports, helped reduce demand in global markets. This has allowed market balance to be maintained despite the significant contraction in Russian exports, which were penalized by international sanctions following the invasion of Ukraine.
Do you want to stay up-to-date on commodity market trends?
Sign up for PricePedia newsletter: it's free!
Price determinants in the EU market
In this context, the price of ammonia was mainly determined by the price of gas, which is the main raw material for its production.In the following, the short-run and long-run coefficients of an Engle and Granger model concerning the EU customs price of ammonia are presented. The variables were subjected to logarithmic transformation in order to interpret the coefficients as elasticities.
Long-term equation of the Engle and Granger model
| Dependent variable | ||
| EU Customs Price - Ammonia Anhydrous | ||
| Regressors | Coefficients | P-Value |
| Constant | -12.79 | 0.000 |
| Liquefied natural gas | 0.73 | 0.000 |
| Consumer price index | 0.75 | 0.000 |
| Global industrial cycle index | 2.39 | 0.000 |
| Statistics | ||
| R2: 0.84 | ||
| Durbin-Watson: 0.58 | ||
Short-term equation of the Engle and Granger model
| Dependent variable | ||
| ΔEU Customs Price - Ammonia Anhydrous | ||
| Regressors | Coefficients | P-Value |
| Constant | 0.00 | 0.808 |
| SHOCK | 0.38 | 0.000 |
| ECM_L1 | -0.25 | 0.000 |
| Statistics | ||
| R2: 0.15 | ||
| Durbin-Watson: 1.63 | ||
From this model, we can see that the price of ammonia is largely determined by the gas-related production factor, inflation and global ammonia scarcity as measured through the global industrial cycle.
Price determinants in the U.S. market
In the U.S. market, however, the price of ammonia and its derivatives appears to be less influenced by production costs and more by competitive constraints imposed by foreign competitors exporting to the United States.
In the regression results, shown below, the U.S. industry's producer price of ammonia and derivatives is only marginally explained by the price of gas in the U.S. market. In fact, the major determinant turns out to be the price of imported ammonia (Ammonia Anhydrous USA CIF).
Long-term equation of the Engle and Granger model
| Dependent variable | ||
| US producer prices - Synthetic ammonia, nitric acid, ammonium compounds and urea | ||
| Regressors | Coefficients | P-Value |
| Constant | 0.13 | 0.247 |
| Ammonia Anhydrous (US CIF) | 0.63 | 0.000 |
| Henry Hub natural gas (US) | 0.12 | 0.000 |
| Statistics | ||
| R2: 0.94 | ||
| Durbin-Watson: 0.60 | ||
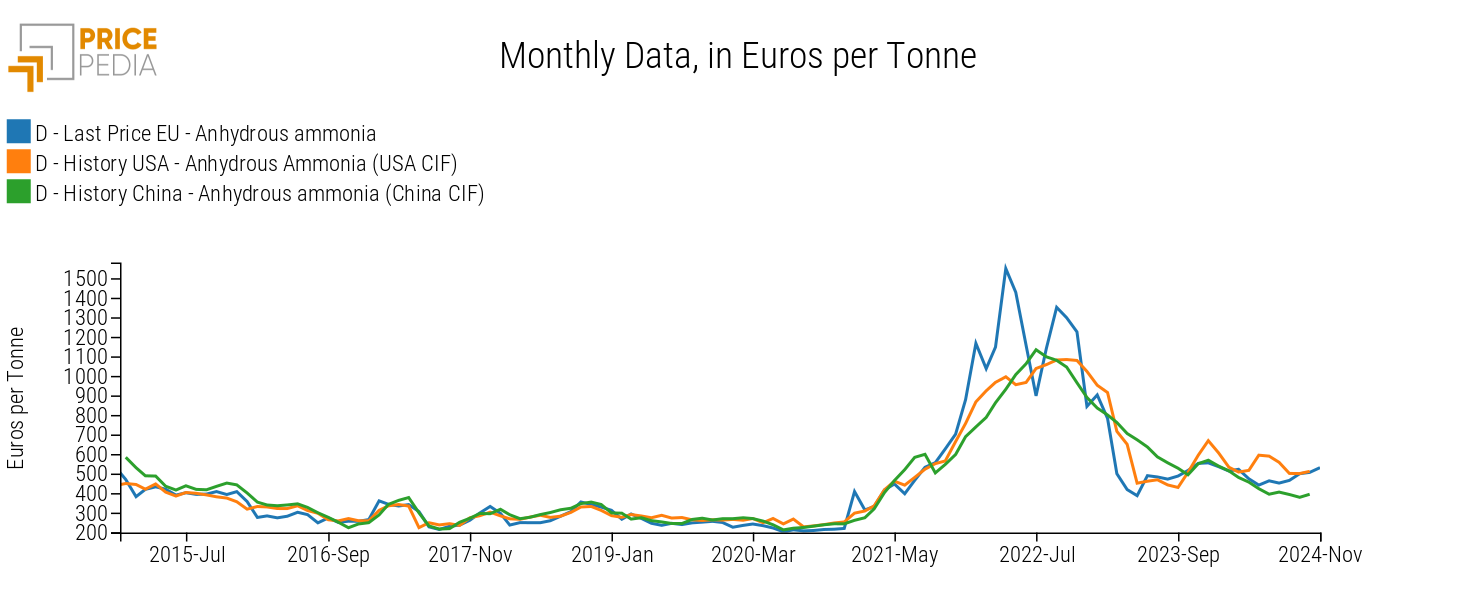
This leads us to hypothesize that there is a single world market for ammonia that can produce a single global price to which different regional prices must be aligned. Comparison of U.S. and China import and EU customs prices seem to support this hypothesis, as shown in the following graph.
EU, US and China price comparison
A model to test the single price hypothesis
To confirm this hypothesis, we tested whether the difference between EU prices and the average of U.S. and CHINA prices (denoted ECM_GlobalPrice) is able to bring a contribution in terms of the error correction mechanism in the short-run equation of the Engel and Granger model estimated earlier for the EU.
Short-term equation of Engle and Granger model, with assumption of single world price
| Dependent variable | ||
| ΔAnhydrous ammonia - EU customs | ||
| Regressors | Coefficients | P-Value |
| Constant | -3.05 | 0.000 |
| SHOCK | 0.43 | 0.000 |
| ECM_LongTerm | -0.24 | 0.000 |
| ECM_GlobalPrice | -0.03 | 0.749 |
| Statistics | ||
| R2: 0.22 | ||
| Durbin-Watson: 1.78 | ||
The new error correction mechanism related to a global price hypothesis (ECM_GlobalPrice) signals the existence of an effect, but with a very small level, such that it is not statistically significant.
This lack of statistical significance should also be considered in light of the difficulty of extracting a large number of signals from data inevitably subject to measurement error. The result points to the existence of a dual correction mechanism in the pricing of ammonia in the EU: on the one hand, a mechanism based on costs and relative scarcity of demand; on the other hand, a mechanism based on global average ammonia prices.
This dynamic leads us not to reject the assumption of a single world price. If this is true, cost differences across geographies tend to translate into variations in profitability levels rather than price differences.
Conclusion
Ammonia is a key global resource, entering multiple key sectors including chemicals and agriculture. The major exporters of this resource are mainly countries rich in natural gas, the main raw material for ammonia production. Among the major importers and users, South Korea has initiated the use of ammonia in the energy sector as well, giving a boost to greener production of this resource.
The determinants of the price of ammonia are given by the cost of production, represented by the most efficient way to produce hydrogen, which is currently derived from natural gas.
From a preliminary analysis, it appears that the global market tends to form a single price for this commodity. Exploring this hypothesis from a statistical point of view, it is not necessarily rejected, leaving open the interpretation that differences in gas costs between different areas of the world tend to be reflected more in different margins rather than different prices.

