Commodity prices between rates and Chinese demand
Chinese demand returns to concern and expectations of rate cuts recede
Published by Luca Sazzini. .
Conjunctural Indicators Commodities Financial WeekThe statements by Federal Reserve (FED) Chair Jerome Powell regarding a potential slowdown in interest rate cuts have caused significant concern among financial market participants, leading to a decline in stock indices.
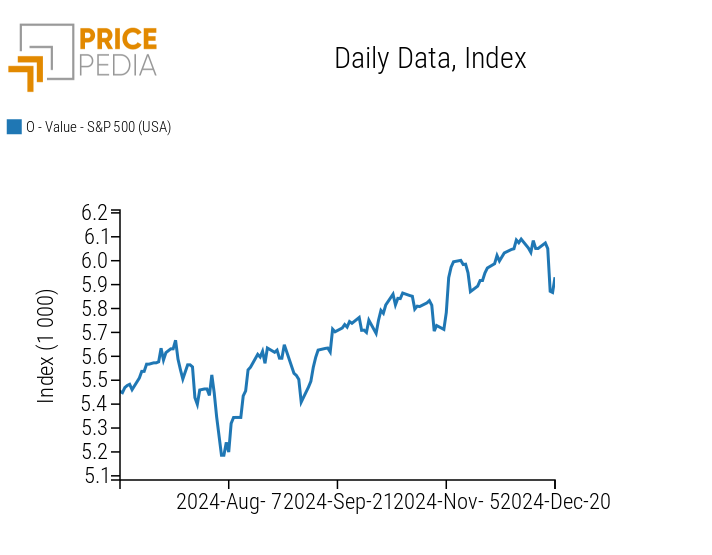
On Thursday, the S&P 500, the stock index of the 500 largest U.S. companies by market capitalization, recorded a nearly 3% drop, marking its steepest daily decline since August. Below is the historical chart of the S&P 500, illustrating the financial market reaction to this week’s FED meeting. Friday's recovery was very modest.
Historical Series of the S&P 500
Weekly Summary of Financial Commodity Prices
In addition to the stock market, commodity markets also experienced a price decline in response to the Federal Reserve's statements. The most significant drop occurred primarily in the metals market, affecting both precious metals, such as gold, and industrial metals, including ferrous and non-ferrous, already heavily influenced by the contraction in Chinese demand.
In the ferrous metals sector, the sharpest decline affected Chinese iron ore quoted on the Dalian Commodity Exchange (DCE), with prices falling primarily due to the ongoing weakness in China’s real estate sector.
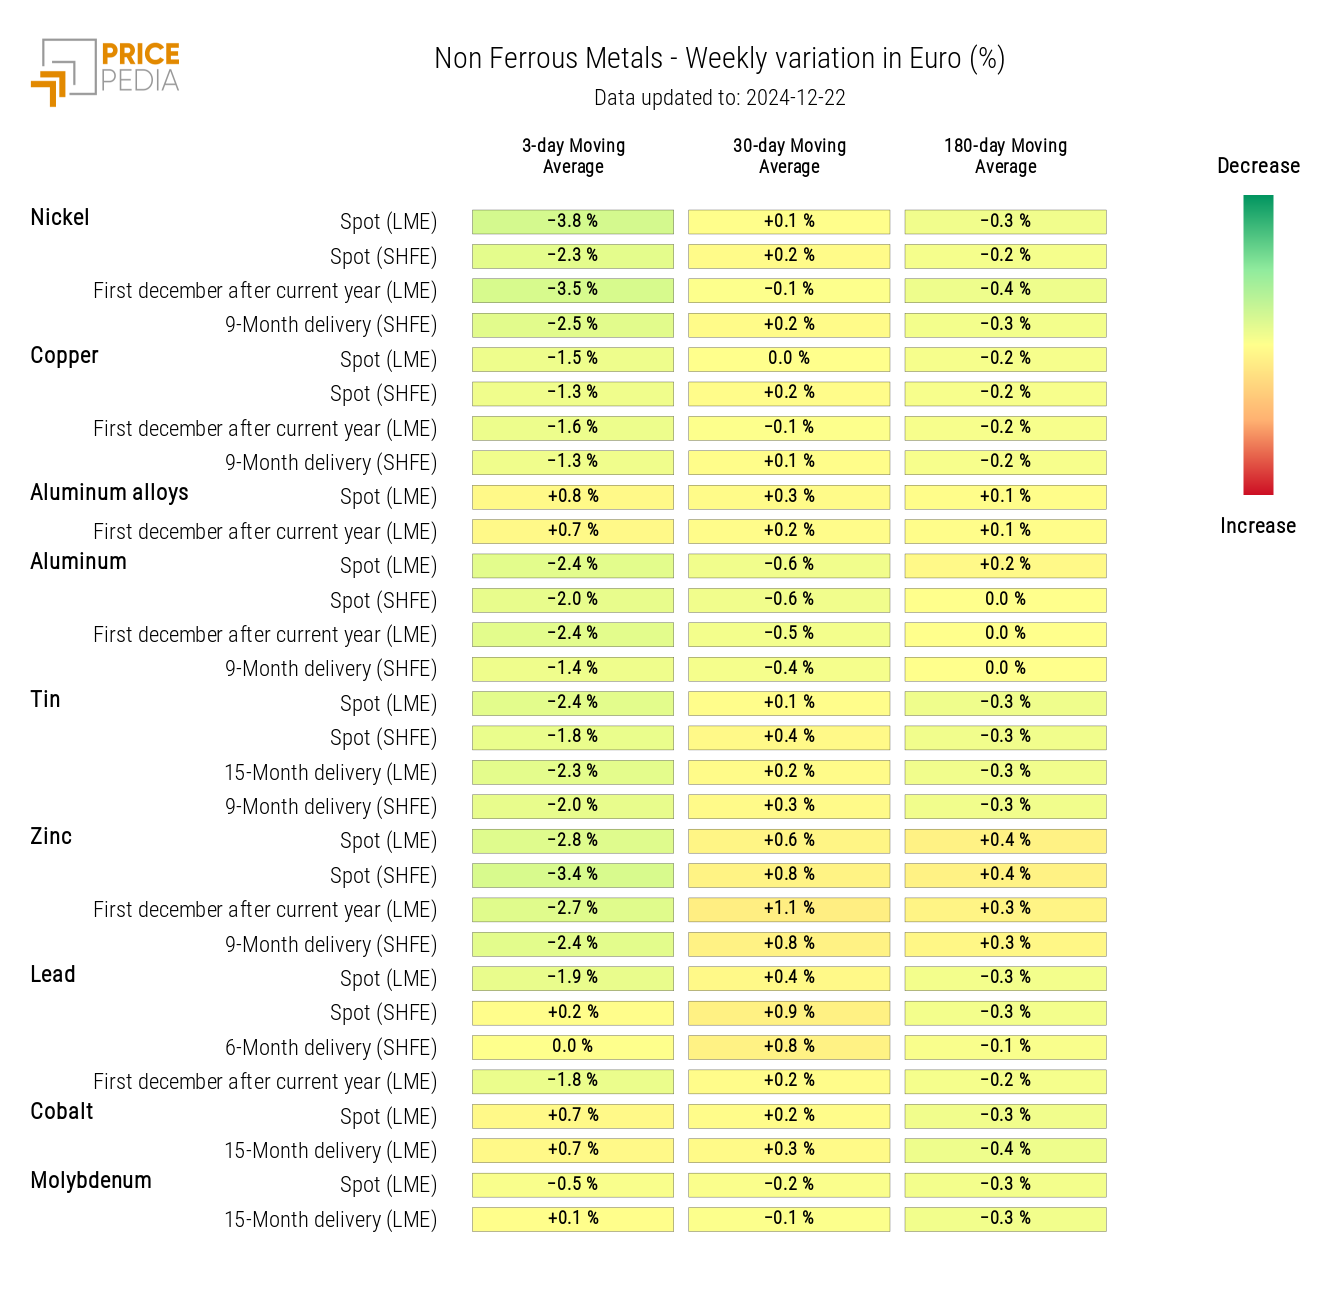
The non-ferrous metals market experienced an even steeper decline, driven by oversupply resulting from reduced Chinese demand and record-high production levels, particularly for aluminum. However, it was not aluminum that suffered the largest losses but nickel, despite Indonesia's statements evaluating significant interventions to curb production and support falling battery prices.
The oil market also faced negative impacts from the Federal Reserve's statements, but more so from the persistent weakness in the Chinese economy. New data on declining Chinese oil demand led to a drop not only in oil prices but in energy products more broadly, particularly in the early days of the week. In recent days, there has been a modest recovery in energy prices, supported by rising Dutch TTF natural gas prices due to the continued depletion of European reserves.
FED Monetary Policy
This week’s FOMC meeting concluded with a rate cut of 25 basis points, bringing the Fed Funds rate to the range of 4.25%-4.5%.
Chair Powell stated that the U.S. economy is strong and continues to grow at a solid pace, allowing the FED to focus primarily on inflation trends for future monetary policy decisions. During the press conference, it was also emphasized that further rate cuts would only be considered if concrete progress is made on the disinflationary front.
Currently, projections indicate only two rate cuts for the next year, a sharp reduction from the four projected in September.
PMI
This week, preliminary estimates for the Purchasing Management Index (PMI) for December were released for both the eurozone and the United States. The index results exceeded analysts' expectations and the previous month’s levels for both economies. However, differences persist between the PMIs of the two regions: while the European economy shows signs of difficulty with a slight contraction, the U.S. economy continues to show growth signals.
The improvements compared to the previous month and forecasts are mainly attributed to the services sector, which remains the main driver for both economies. Conversely, the manufacturing sector continues to show significant weakness, particularly in the European industry, which remains on a contractionary trend with no signs of easing compared to November’s data.
Eurozone
The eurozone composite PMI increased to 49.5, up from 48.3 in the previous month.
The manufacturing PMI remained stable at 45.2, slightly below analysts' expectations, which had anticipated a slight easing of the sector’s contraction by a decimal point (45.3).
The services PMI again surpassed the critical 50-point threshold, rising to 51.4 from 49.5 in November, exceeding analysts' estimates, which had predicted an unchanged value. This result is particularly positive, as the previous month’s drop below 50 points had raised concerns among economists that the weakness in manufacturing might have spread to services.
Significant improvements were recorded in Germany and France, thanks to the growth in the services sector, which partially offset the weakness in manufacturing, contributing to increases in their respective composite PMIs. However, the composite indices of both countries remain below the 50-point threshold, with values of 47.8 for Germany and 46.7 for France. Although these figures are theoretically negative, being below the 50-point mark, it is worth noting the improvement compared to the previous month, when the PMIs were at 47.2 and 45.9, respectively.
United States
In December, the composite PMI of the United States reached 55.6 points, marking an increase from the previous month (54.9) and slightly exceeding analysts’ forecasts (55.1).
The manufacturing PMI dropped to 48.3, below November’s figure (49.7) and analysts’ expectations (49.4). On the other hand, the services PMI showed significant growth, rising from 56.1 to 58.5, far exceeding analysts’ projections of 55.7.
ENERGY
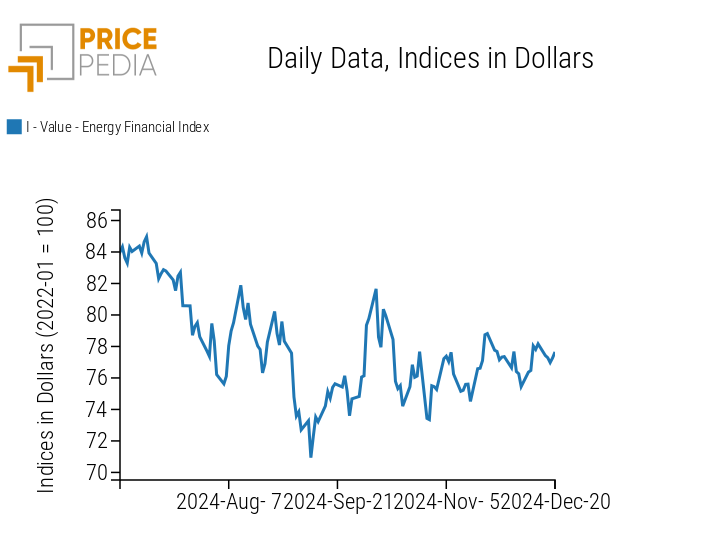
The PricePedia Energy Product Index shows a phase of weakness linked to low Chinese demand.
PricePedia Financial Index of Dollar Energy Prices
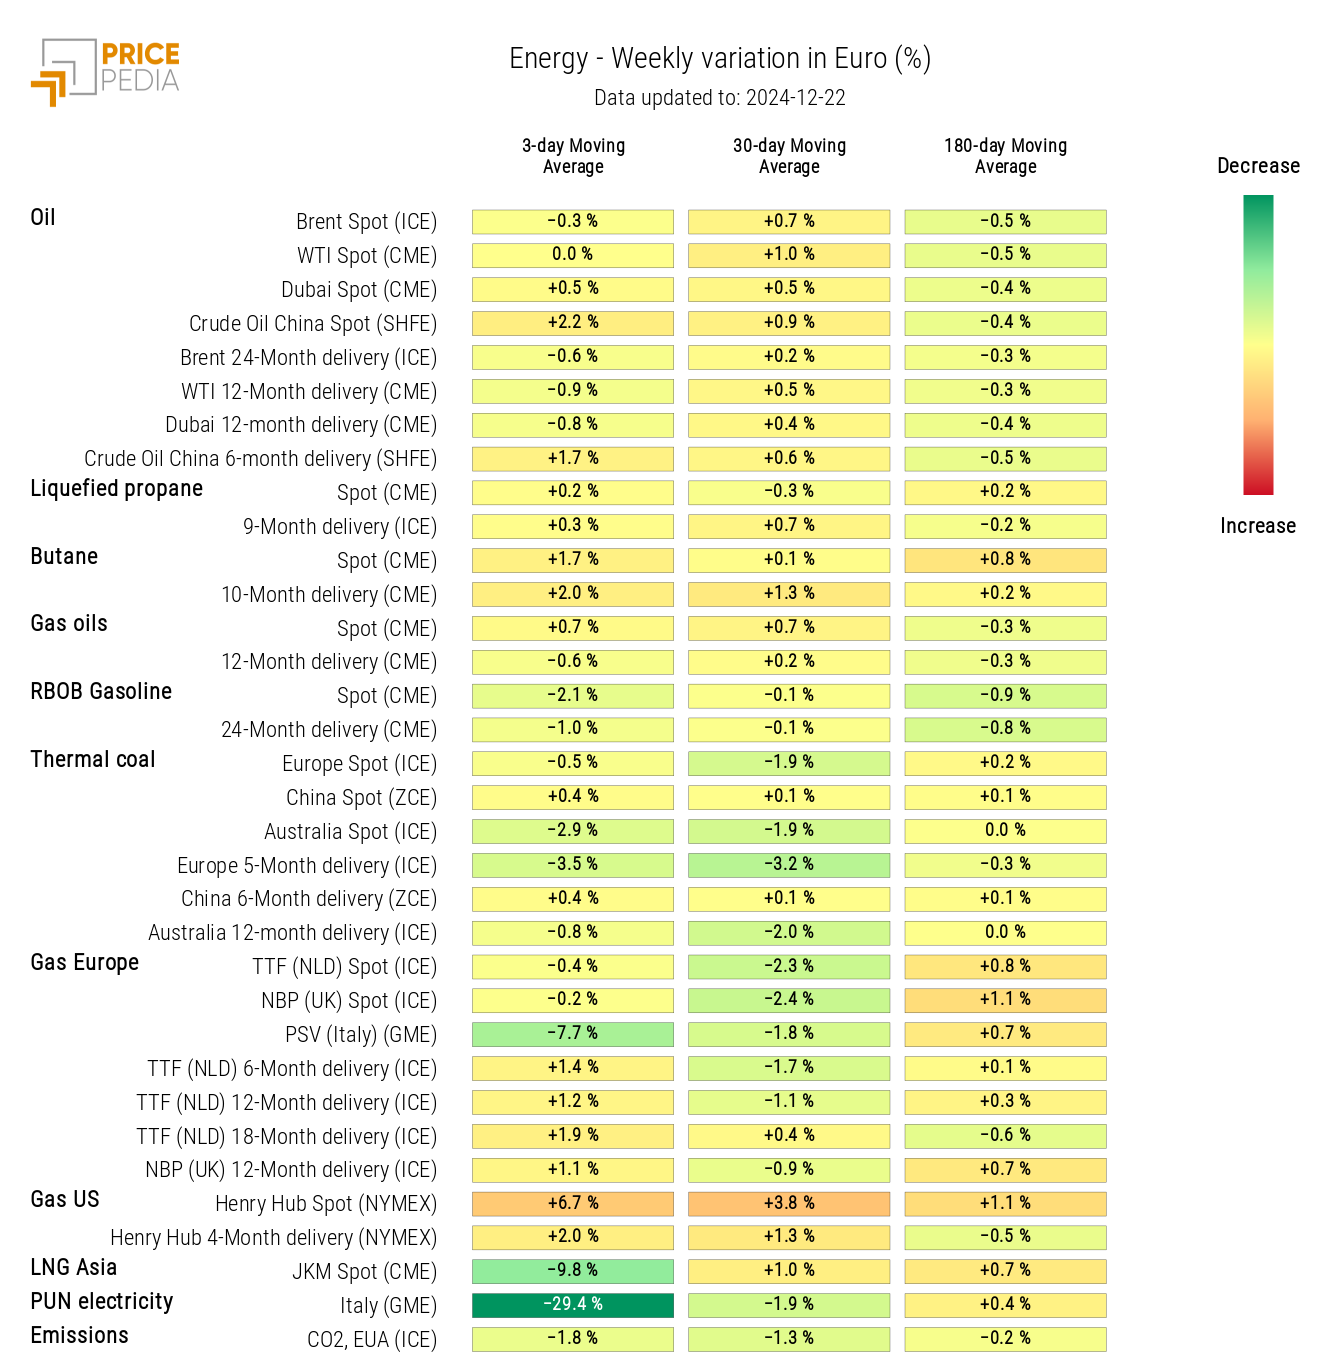
The energy heatmap highlights a weekly reduction in the 3-day moving average, particularly for prices of the Italian National Single Price (PUN) for electricity, natural gas traded at the Italian Virtual Trading Point (PSV), and Japan/Korea Marker LNG (ASIA JKM).
The reasons are varied:
- Asian gas reflects the closure of trades for January 2025 deliveries and the transition to one-month trades for the February 2025 contract;
- For Italian gas, the reduction is due to realignment with Dutch TTF gas prices;
- For the Italian PUN electricity, the sharp weekly decline is due to the increasing erratic behavior between weekday and weekend prices.
Energy Prices HeatMap in Euros
PLASTICS
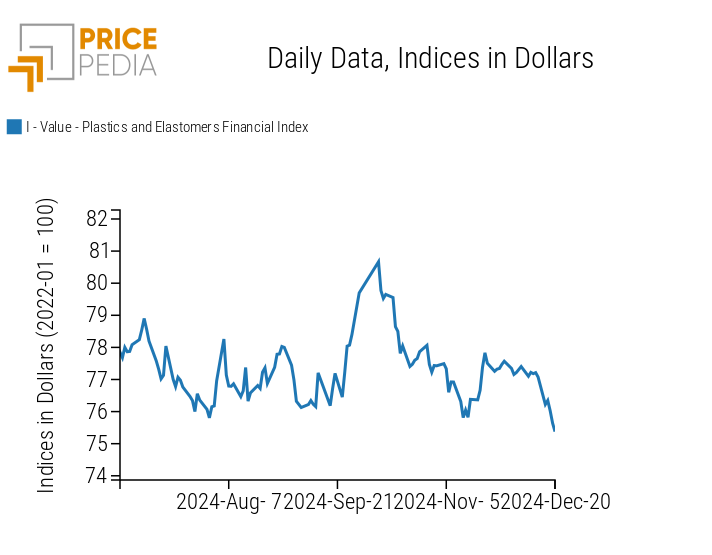
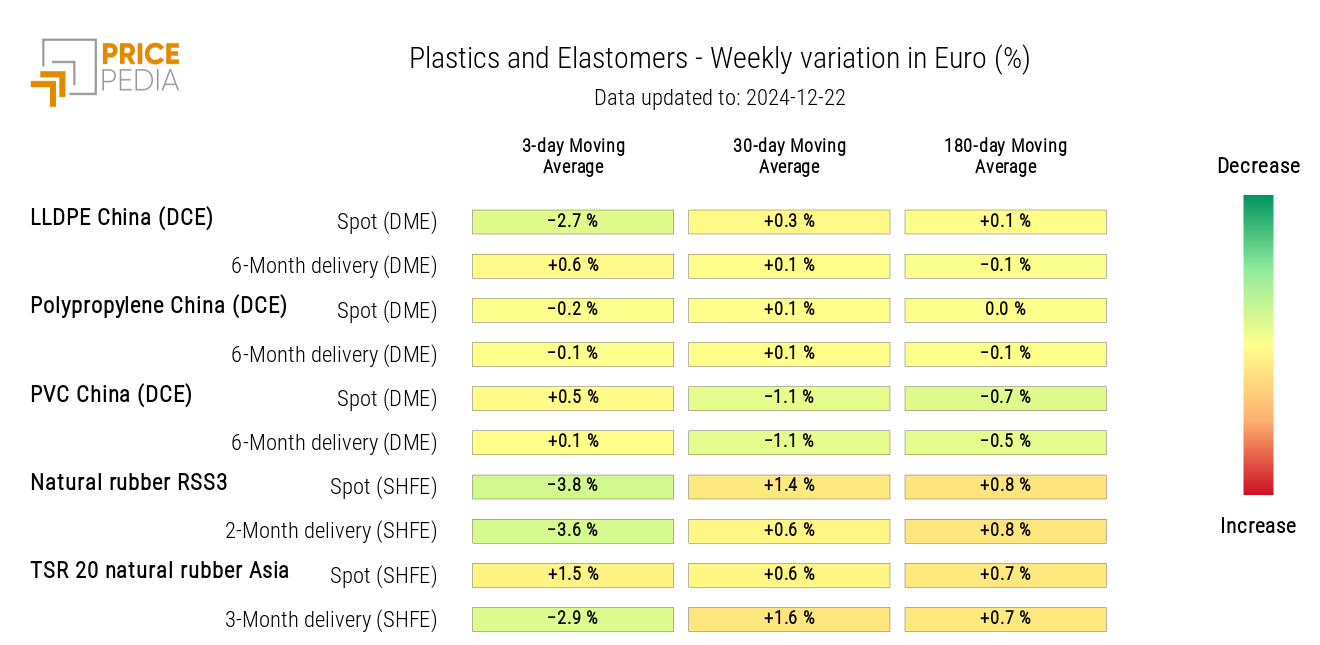
The PricePedia Financial Index of Plastics and Elastomers Prices follows the decline in prices of LLDPE and RSS3 natural rubber, as indicated by the following heatmap.
PricePedia Financial Indices of Dollar Plastics Prices
HeatMap of Plastics and Elastomers Prices in Euros
FERROUS METALS
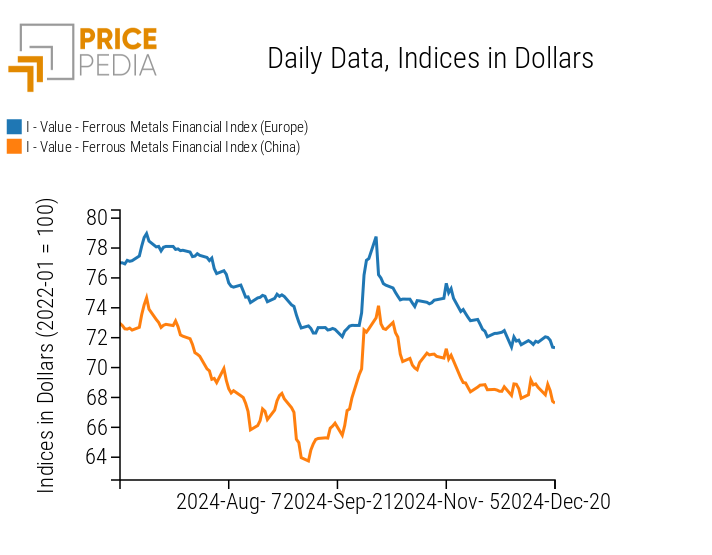
This week, there is a decrease in prices for both ferrous indices, with the China index confirming itself as the most volatile of the two.
PricePedia Financial Indices of ferrous metal prices in dollars
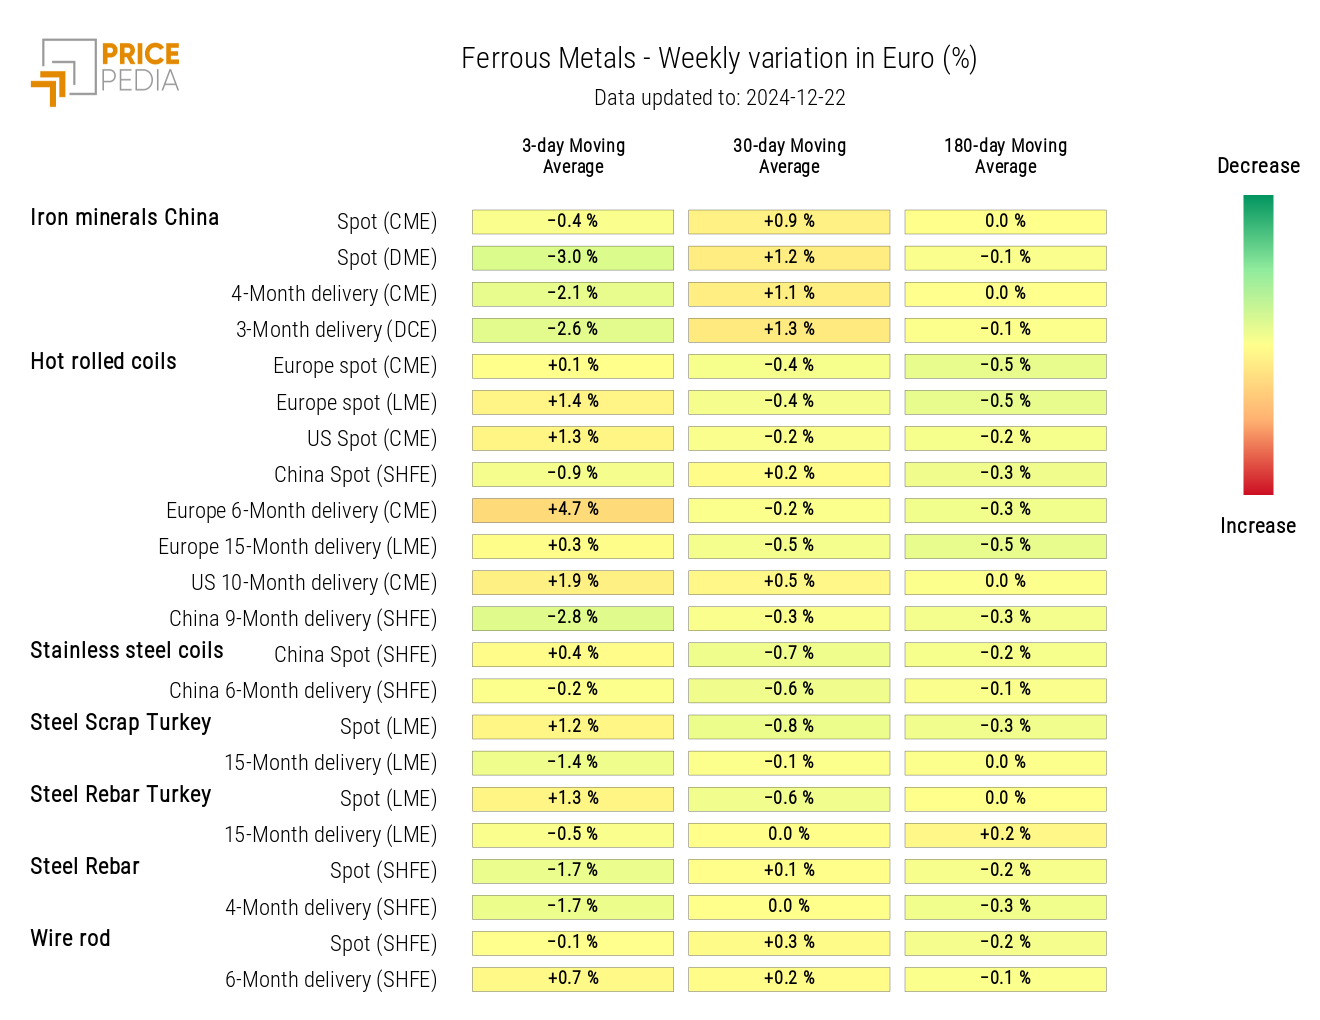
The heatmap analysis highlights the decline in prices of Chinese iron ore listed on the Dalian Commodity Exchange (DCE).
HeatMap of ferrous prices in euros
Do you want to stay up-to-date on commodity market trends?
Sign up for PricePedia newsletter: it's free!
NON-FERROUS INDUSTRIAL METALS
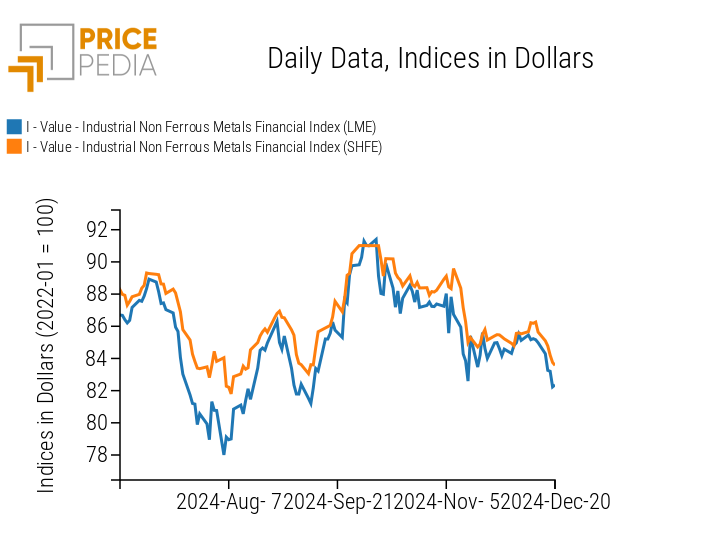
The financial indices of non-ferrous metals listed on the London Metal Exchange (LME) and the Shanghai Futures Exchange (SHFE) both follow negative trends.
PricePedia Financial Indices of non-ferrous industrial metal prices in dollars
The heatmap analysis highlights the general decline in non-ferrous metal prices.
HeatMap of non-ferrous metal prices in euros
FOOD
This week, the financial indices of food items recorded opposing dynamics.
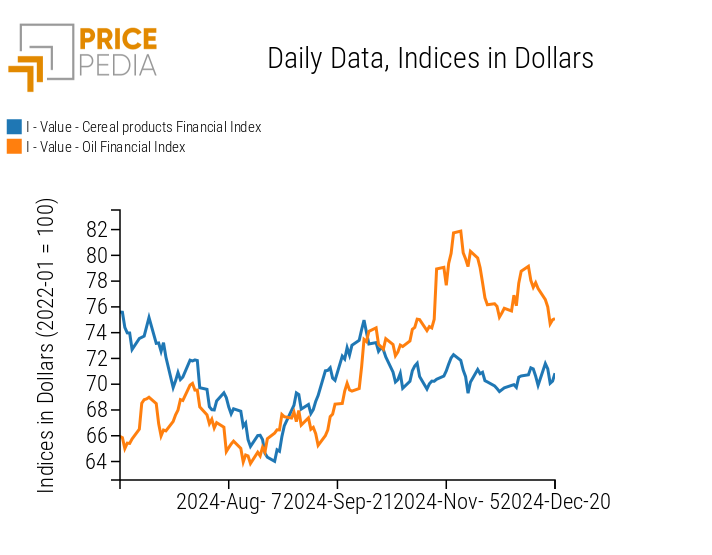
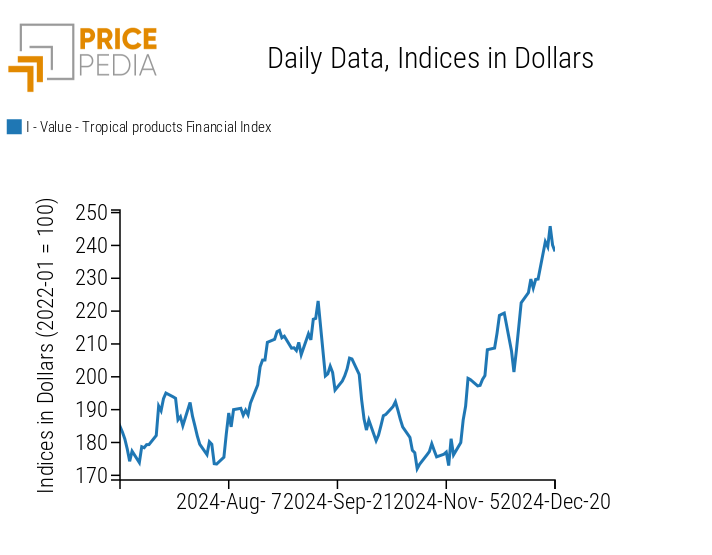
The tropical index continues to show a positive price trend, while the edible oils index is influenced by a negative weekly trend. The cereals index exhibits mostly lateral price movements, interspersed with fluctuations in opposite directions.
| PricePedia Financial Indices of food prices in dollars | |
| Cereals and Oils | Tropicals |
|
|
CEREALS
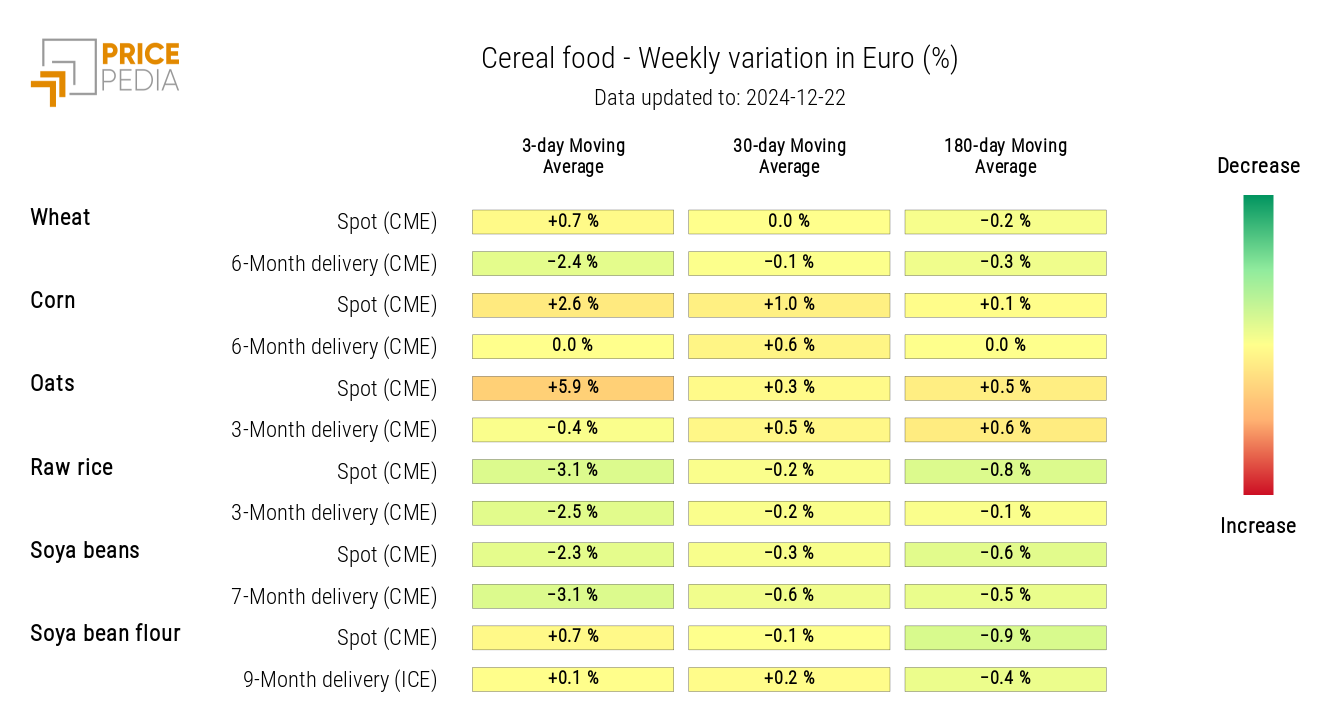
The cereals heatmap shows scattered and mild variations: the prices of oats and corn are rising, while those of rough rice and soybean are decreasing.
HeatMap of cereal prices in euros
TROPICALS
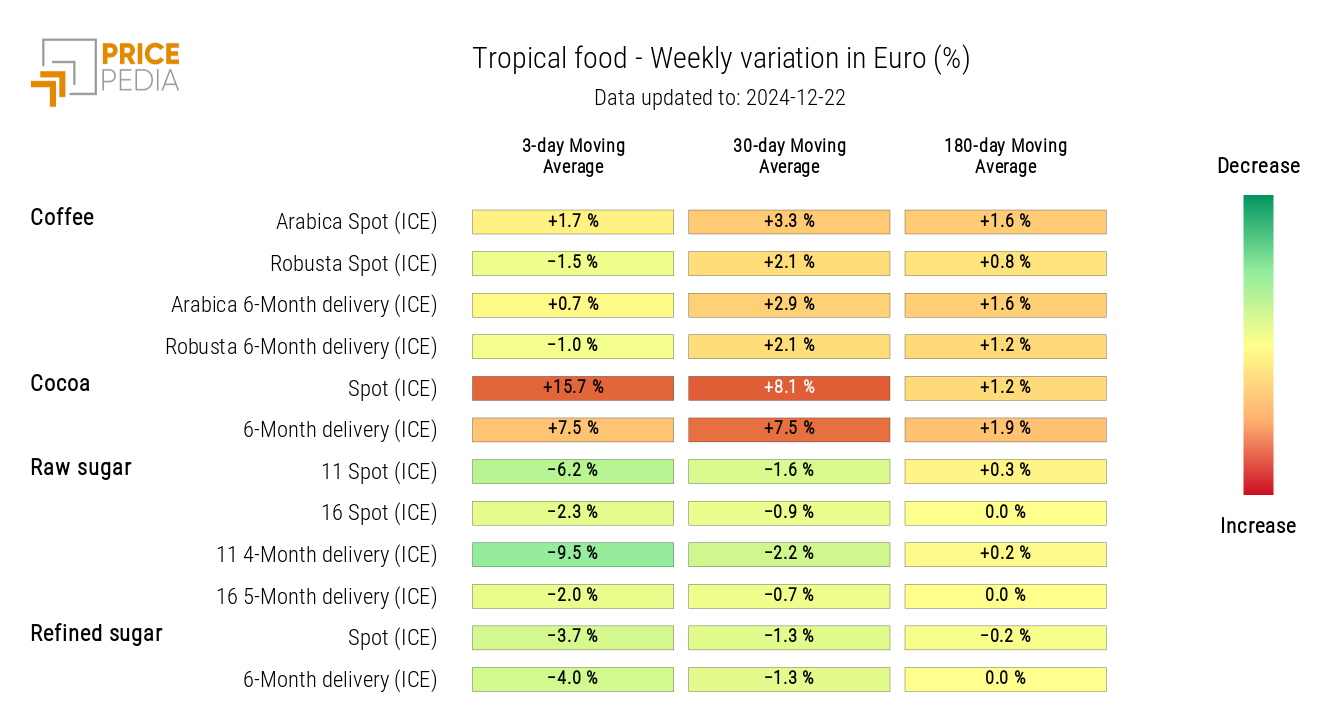
The tropicals heatmap shows a sharp rise in cocoa prices, contrasting with a decline in sugar prices.
HeatMap of tropical food prices in euros
OILS
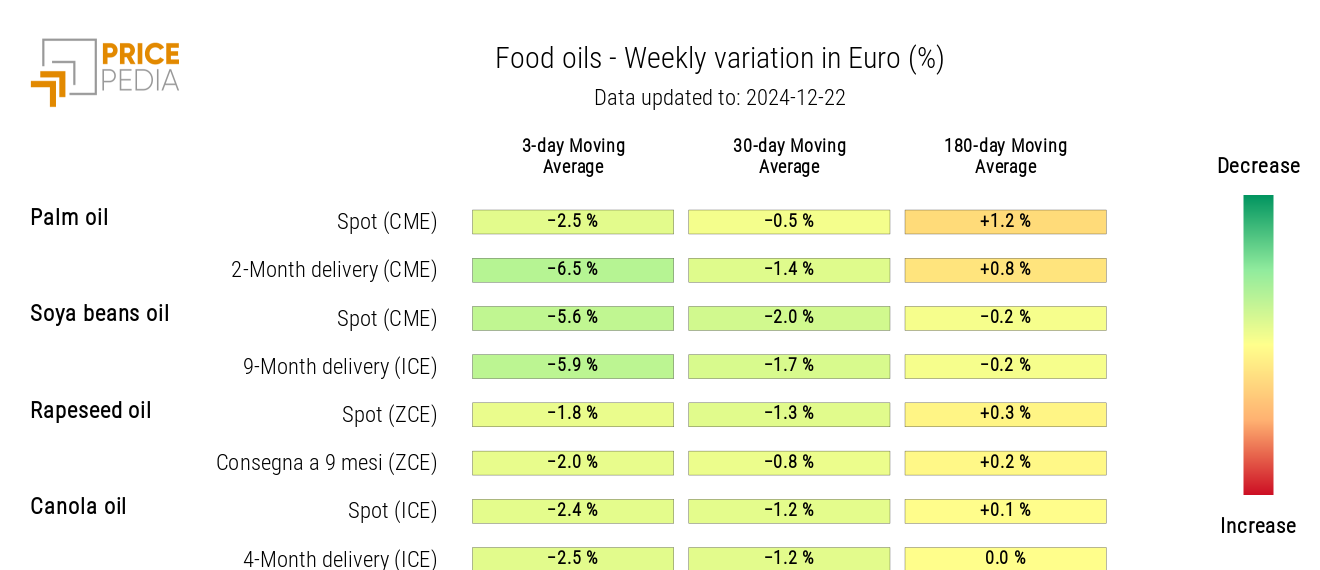
The oils heatmap reports an overall decline in edible oil prices, particularly for soybean oil.
HeatMap of edible oil prices in euros
