Downward trend for commodity prices in 2024 with key exceptions: natural gas, cocoa, gold and silver
Weak demand has driven price dynamics
Published by Luigi Bidoia. .
Conjunctural Indicators Commodities Financial WeekEnergy Commodity Prices
2024 closes amidst tensions in the gas markets, consolidating the diverse trends in energy commodity prices recorded throughout the year.
2024: Rate of Price Changes from Start to End of Year
| Energy Commodities | In USD | In EUR |
| Brent Crude Oil | -3.5% | +1.4% |
| Natural Gas TTF (Netherlands) | +42.5% | +49.6% |
| Natural Gas Henry Hub (USA) | +44.7% | +51.9% |
| LNG JKM (Asia) | +21.5% | +27.5% |
| Thermal Coal Australia (ICE) | -0.8% | +4.6% |
Despite the relative stability of oil and coal prices, gas prices have recorded significant increases over the 12 months of 2024, particularly for European gas traded on the Dutch TTF and for gas traded at the Henry Hub in the United States.
These increases reflect the ongoing process of replacing the EU's gas imports from Russia with liquefied natural gas (LNG) imported from the United States. Between 2021 and 2024, EU gas imports from Russia fell by over a third, while imports from the United States nearly doubled. This substitution process will continue at least through the current winter, creating phases of tension in the European and American markets and, more broadly, in the global LNG market.
An example of recent tensions can be seen in the last two weeks of the year: in just 14 days, TTF prices increased by 16% in euros, while Henry Hub prices in the United States rose by 8%.
The reasons for the recent increases in TTF gas prices include:
- Colder temperatures and lower renewable energy production, driving up gas demand in Europe, with a 20% year-on-year increase since early December;
- Reduced LNG imports, down by over 10% year-on-year in December, due to lower global LNG production;
- Lower gas levels in EU storage sites at the end of 2024, significantly below those at the end of 2023;
- The likely halt of Russian gas transit through Ukraine from January 1, 2025, as a potential agreement between Russia and Ukraine appears increasingly unlikely.
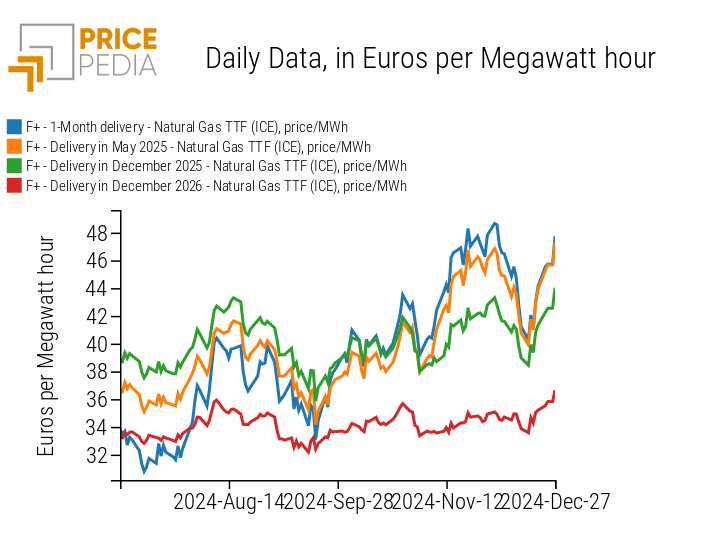
A clear signal of how these tensions are expected to characterize this winter, before gradually easing and leading to a reduction in prices, emerges from the comparison of TTF gas prices for deliveries in different months. The graph below shows TTF gas quotations for January and May 2025 deliveries, as well as for December 2025 and 2026 deliveries.
TTF Gas Prices for Different Delivery Periods

The graph clearly shows that recent price increases for short-term deliveries have also impacted May 2025 delivery prices. However, these increases have had a smaller effect on December 2025 delivery prices and an even more limited impact on December 2026 deliveries. At the end of 2024, the price for December 2026 deliveries is over 10 euros lower per kWh than the price for January 2025 deliveries.
Industrial Commodities
2024 was characterized by relative stability in the prices of industrial raw materials, especially when compared to the significant fluctuations recorded during the 2020-2023 period. Since the beginning of 2024, the main financial price indices from PricePedia have shown the following changes:
2024: Rate of Change in Financial Prices from Start to End of Year
| Industrial Commodity Indices | In USD | In EUR |
| Non-ferrous metals (London Metal Exchange) | +4.5% | +9.7% |
| Non-ferrous metals (Shanghai Future Exchange) | +3.9% | +9.0% |
| Ferrous metals Europe | -18.0% | -13.9% |
| Ferrous metals China | -20.4% | -16.4% |
Considering the prices of industrial commodities in physical markets, the underlying trend has been a slight decline, as highlighted in the following table.
2024: Rate of Change in Physical Prices from Start to End of Year
| Industrial Commodity Indices | In USD | In EUR |
| EU Customs | -2.9% | +1.0% |
| China Customs | -3.4% | +0.5% |
In light of this slight downward trend, the increase, albeit modest, in the index of non-ferrous metals listed on the London Metal Exchange (LME) and the Shanghai Future Exchange (SHFE) can be attributed to the financial markets' tendency to anticipate future price trends, which are expected to rise due to increased demand for metals necessary for the energy transition.
Precious Metals
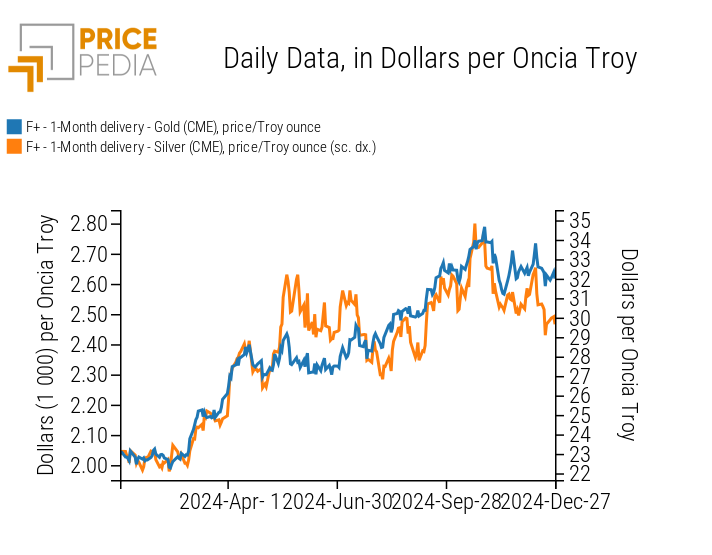
2024 was marked by the continued growth, at least until October, of gold and silver prices. On Oct. 30, the price of gold reached its all-time high of $2,789 per ounce. A few days earlier, the price of silver had reached $34.8 per ounce. In the final months of the year, the prices of precious metals experienced a slight decline but remained at particularly high levels.
Financial Price of Gold and Silver

Food Commodities
The path followed by food commodity prices in 2024 was more eventful, particularly for tropical food products such as coffee and cocoa.
2024: Rate of Change in Physical Prices from Start to End of Year
| Food Commodity Indices | In USD | In EUR |
| Cereals | -12.1% | -7.6% |
| Oils | +14.5% | +20.2% |
| Tropicals | +80.3% | +89.3% |
In 2024, the prices of tropical food products recorded the highest growth among the PricePedia financial price indices. Among tropical goods, cocoa prices saw the largest increase, rising by 137% in USD over the year.
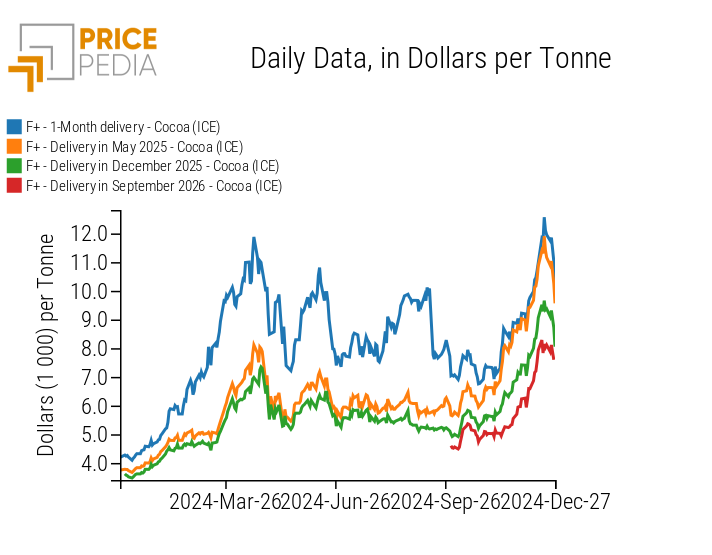
Cocoa prices were notable not only for their substantial increases but also for their high volatility, indicating significant speculative activity by financial operators. Periods of sharp increases were followed by equally sharp declines. A striking example occurred in recent days: after reaching the staggering price of $12,585 per ton on December 18, cocoa prices began a decline, falling to $10,124 per ton as of December 27.
Analyzing cocoa prices by contract maturity and delivery schedule reveals distinct phases of price growth during 2024. The chart below shows prices for deliveries in January, May, and December 2025, as well as September 2026.
Financial price of cocoa

The first phase, from January to April, saw increases across both short-term contracts and those maturing by the end of 2025, suggesting that financial markets considered the supply constraints and resulting price hikes to be enduring. The second phase, from May to October, was characterized by significant spot price fluctuations, which translated into relatively modest movements in longer-term prices. This indicated the predominance of financial factors not broadly supported by consensus on supply assessments among operators. The third phase, during the final months of 2024, saw short-term price changes once again fully reflected in longer-term prices. This is a sign that supply-side information has become available that suggests that this will remain very low not only in 2025, but also for much of 2026.


