Determinants of gas prices
Argued list of factors that contribute to gas prices
Published by Luigi Bidoia. .
Natural Gas Price DriversDeterminants of Gas Prices
An Annotated List of Factors Contributing to Gas Price Formation in Various Markets
From the post-war period until 2020, the dynamics of natural gas prices largely followed those of oil prices. During this period, most studies on energy markets focused on the dynamics of oil prices, considered by far the most relevant. However, the gas crisis of 2021-2022 radically changed the relationship between the oil and gas markets, making it increasingly necessary to understand the determinants of the gas market independently, both regionally and globally. The variables involved in the gas market are significantly more numerous than those in the oil market, making gas analysis considerably more complex.
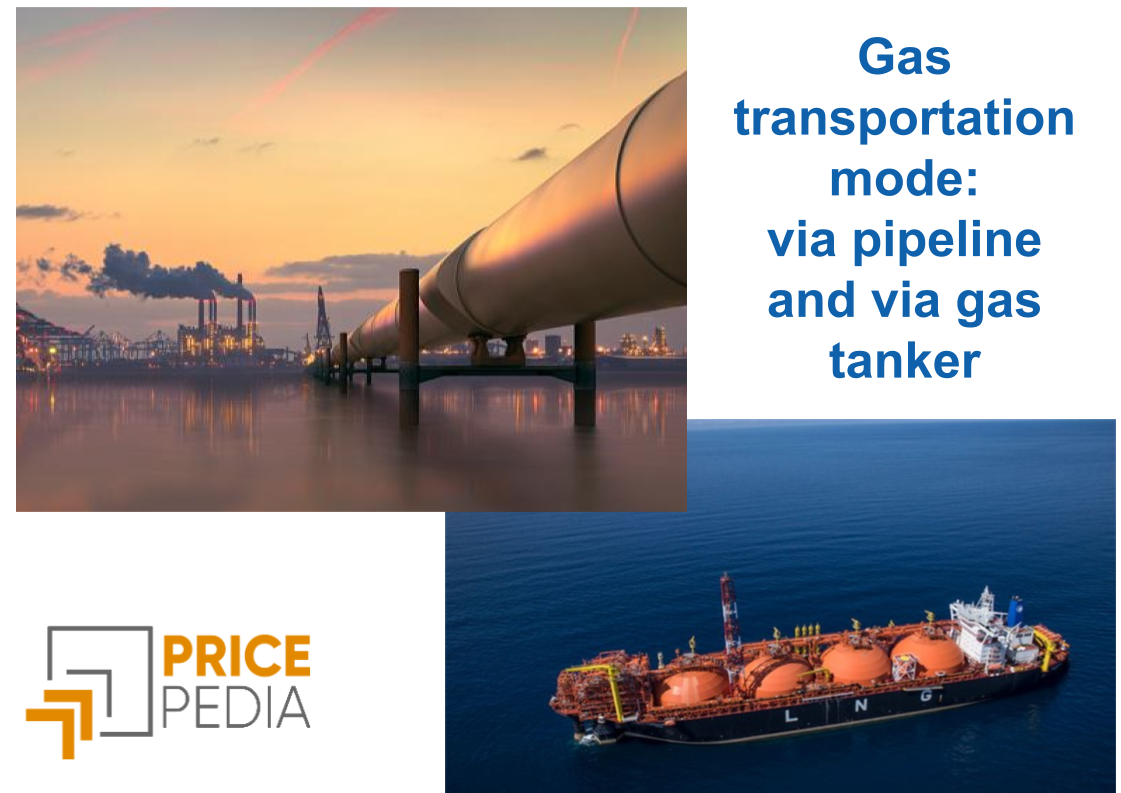
A crucial factor complicating the analysis of the gas market compared to the oil market is the existence of two distinct modes of transport. Natural gas can be transported either in gaseous form through pipelines or in liquid form via LNG carriers. From an analytical perspective, the first case refers to dry gas, while the second case refers to Liquefied Natural Gas (LNG).
Unlike oil, the global supply of gas as a mineral resource is very abundant, even leading in some cases to negative market prices[1]. However, the main issue with gas is transportation to make it available near end-users.
While the LNG supply can be considered global on a worldwide scale,
the supply of dry gas is highly localized due to the need for fixed pipeline infrastructure for its transport. For instance, in Europe, the existence of an interconnected pipeline network makes the European market a relatively homogeneous regional market characterized by a single regional price. In contrast, the situation differs in the other two main regional markets—North America and the Asia-Pacific. In North America, the existing pipeline network is still insufficient to establish a single dry gas price for the entire region, while in the Asia-Pacific region, the network mainly consists of isolated lines.
In summary, studying the global gas market means analyzing:
- the gas demand of individual countries;
- the global LNG market;
- the European regional gas market via pipelines;
- the North American and Asia-Pacific regional gas markets via pipelines;
- the interrelationships between the global LNG market and regional gas markets via pipelines.
Below is a brief overview of the main determinants for the five areas listed above[2].
1.0 Gas Demand in Different Countries
During this century, gas demand has experienced significant growth, driven by its role as an intermediate phase between the use of high CO2-emission fossil fuels and the increasing adoption of renewable energy sources. Between 2013 and 2023, global gas consumption rose from 3,372 billion m3 to 4,010 billion m3, with an average annual growth rate of 1.7%. While consumption decreased in Europe, demand grew in Asia at an average annual rate close to 4%, with particularly notable growth in China (+8.9%). With consumption exceeding 400 billion m3, China has nearly reached the levels of the entire European market.
Gas consumption is expected to continue increasing in the coming years, while, in the longer term, the prospects for natural gas demand will strongly depend on the pace of the energy transition.
One of the most distinctive features of gas demand is its pronounced seasonality, coupled with significant short-term volatility. Heating-related consumption is highly seasonal and subject to unpredictable variations during the winter seasons. Conversely, consumption in the electricity sector critically depends on the production of electricity from renewable sources, given the compensatory role played by gas-fired power plants in various power systems. Finally, industrial gas consumption is heavily influenced by the business cycles of high gas-consuming sectors.
These factors make gas demand extremely variable and, consequently, uncertain in both the short and medium-to-long term. In this context, a forecasting scenario should consider, for each country or market, the following elements:
- the weekly, or even daily, production of electricity from renewable sources;
- average monthly temperatures;
- the phases of the business cycle in high gas-consuming sectors;
- the pace at which the energy transition is progressing.
The high variability in gas demand translates into greater price volatility, making gas quotations in financial markets a particularly attractive speculative asset for financial operators.
2.0 The Global LNG Market
Over the past decade, the global LNG market has experienced significant growth, increasing from 327 billion m3 in 2013 to 549 billion m3 in 2023, with an average annual growth rate of 5.9%.
Three countries — the United States, Qatar, and Australia — hold a leading position, with exports exceeding 100 billion m3. Among the "follower" countries, Russia leads the group, although its exports have never surpassed 50 billion m3.
Global demand is relatively concentrated among the European Union, China, Japan, and South Korea, which together account for over three-quarters of total global LNG imports. In the European Union and China, LNG competes with pipeline gas to meet the total gas demand. In Japan and South Korea, however, gas demand is entirely focused on LNG.
The supply and demand of LNG strongly depend on the availability of liquefaction terminals (for exports) and regasification terminals (for imports), as well as the capacity of regional networks to absorb LNG supplies. Another critical infrastructural constraint is the capacity of the global fleet of LNG carriers, which is essential for transporting LNG from production sites to consumption markets. However, the availability and modernization of these carriers often fail to keep pace with the growing global demand. Long construction times, high costs, and technological constraints can create logistical bottlenecks, limiting overall transport capacity.
In summary, the global LNG market is heavily influenced by the capacity of various infrastructures, whose development generally requires long lead times.
Given the importance of infrastructure, any forecast for the global LNG market must begin with an analysis of ongoing or planned expansion and modernization projects. Strategies adopted by individual countries play a particularly crucial role.
Among exporting countries, Australia's strategy differs from that of Qatar and the United States. While Qatar and the United States are pursuing ambitious plans to expand their export capacity, Australia appears to focus on optimizing its existing infrastructure, with particular attention to environmental and regulatory issues.
Among importing countries, the Asia-Pacific nations (China, Japan, and South Korea) have the largest regasification capacity. India is also investing significantly in expanding its regasification capacity to support growing energy demand and promote the use of natural gas as a cleaner fuel, thereby reducing emissions.
In the European Union and the United Kingdom3, nearly 50 regasification terminals are operational, with a total capacity of approximately 300 billion m3. Since the beginning of the war in Ukraine, the EU has increased its regasification capacity by 36.5 billion m3. In 2024, the utilization rate of these terminals was slightly above 50%. Over the next three years, several expansions are planned, along with the commissioning of seven new terminals, including the Floating Storage and Regasification Unit (FSRU) in Ravenna and the LNG regasification terminal in Porto Empedocle, scheduled to begin operations in 2026.
With these developments, Europe is likely to face an excess regasification capacity relative to the demand for methane and LNG, even in a medium-term outlook.
3.0 The European Gas Market
The European gas market is the only fully integrated regional market capable of forming a single daily gas price for the entire European Union. The regional benchmark is represented by the Day-Ahead Market price traded at the Dutch Title Transfer Facility (TTF). This price also serves as the underlying for TTF gas contracts traded on both the Intercontinental Exchange (ICE) and the Chicago Mercantile Exchange (CME).
In the European market, this benchmark serves as a reference point for both pipeline-imported gas and LNG injected into the network after regasification.
Before Russia’s invasion of Ukraine and the subsequent sanctions, the EU imported approximately 230 billion m3 of dry gas, primarily from Russia. In 2023, EU imports dropped to just over 110 billion m3, with the majority coming from Norway, while imports from Russia became marginal. In 2024, Russian imports saw a slight recovery. However, another significant drop is expected in 2025 due to the planned closure of the pipeline connecting Russia to the EU through Ukraine.
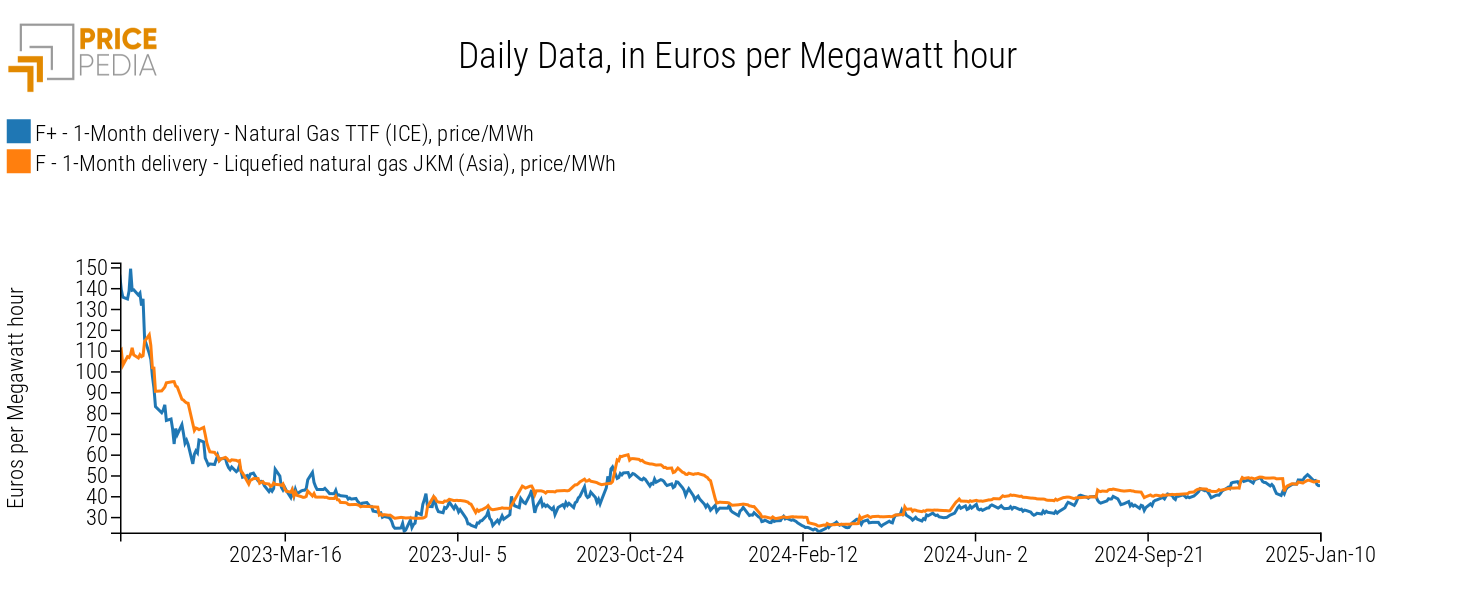
The EU's increased reliance on LNG compared to pipeline gas has led to greater integration between the European gas market and the global LNG market. This integration is reflected in the growing correlation between the financial price of TTF gas listed on ICE and the financial price of LNG listed on CME, with the Japan/Korea Marker (JKM) price as the underlying, as shown in the chart below.
Comparison of Daily Financial Prices of TTF and JKM Gas

Since 2023, the correlation between the two prices, calculated on a daily basis, stands at 0.86. On a monthly basis, the correlation rises to 0.98.
4.0 Other Regional Markets
In addition to the EU market, two other regional markets show integration between the LNG segment and the dry gas segment: the American market and the Chinese market, which have fundamentally different market structures. The structure of the Chinese market is similar to that of the EU, with LNG supply competing with dry gas supply to meet overall gas demand. This means that variations in the supply of dry gas in the Chinese market lead, as in the EU market, to opposite changes in LNG demand.
In contrast, the structure of the American market is the opposite. Variations in the supply of dry gas, given adequate infrastructure, result in a corresponding increase in supply to the global LNG market. The primary bottleneck in the American market is not the capacity to extract gas but the infrastructure required to transport the gas to liquefaction plants and convert it into LNG. As planned investments progressively address these bottlenecks, the American supply to the global LNG market is expected to grow significantly.
5.0 Interrelations Between the Global LNG Market and Regional Dry Gas Markets
In each regional market, the supply of LNG competes with the supply of dry gas to meet the overall demand for gas. Since, under equal conditions, the production and distribution costs of dry gas are significantly lower than those of LNG, gas markets tend to prioritize dry gas supply first, directing any excess demand toward LNG supply. In the presence of infrastructure allowing a single network to distribute both regasified LNG and dry gas, the prices of LNG and dry gas tend to equalize, as they are perfectly substitutable from the consumer’s perspective.
In contrast, in the absence of such infrastructure, the price of dry gas will tend to be lower than that of LNG.
The actual data, shown in the table below, fully confirm this analysis.
Gas Prices by Market and Type (euros per ton)
| 2019 | 2020 | 2021 | 2022 | 2023 | 2024 | |
| European Market | ||||||
| Liquefied Natural Gas | 268 | 193 | 530 | 1275 | 671 | 512 |
| Dry Natural Gas | 245 | 171 | 511 | 1449 | 645 | 535 |
| China Market | ||||||
| Liquefied Natural Gas (CIF) | 421 | 321 | 431 | 754 | 582 | 526 |
| Dry Natural Gas (CIF) | 321 | 257 | 235 | 371 | 371 | 353 |
| United States Market | ||||||
| Liquefied Natural Gas (FOB) | 215 | 227 | 298 | 534 | 327 | 267 |
| Dry Natural Gas (CIF Canada) | 117 | 95 | 161 | 323 | 179 | 91 |
| Dry Natural Gas (FOB Mexico) | 125 | 101 | 170 | 306 | 132 | 116 |
The global LNG market acts as a connecting bridge between otherwise separate regional markets. This means that tensions in one regional market tend to impact other regional markets as well. This phenomenon explains the dynamics of gas prices across various markets during the 2021-2022 cycle. Initially, tensions affected the European dry gas market. From there, they extended to the LNG market, influencing Chinese LNG import prices and American LNG export prices. Due to the global increase in LNG prices in 2022, the prices of pipeline-transported gas in China and the United States also experienced significant growth.
Conclusions
With the drastic reduction in EU gas imports from Russia via pipeline, the European gas market has become structurally integrated into the broader global LNG market. This evolution has progressively reduced the effectiveness of analyses that consider only supply and demand within the EU gas market. The price of gas in the EU market is increasingly influenced by global LNG supply and demand. The EU, representing about a quarter of global LNG demand, significantly impacts the global market, especially when changes are particularly intense, driven by shifts in pipeline gas imports or fluctuations in renewable energy production.
Unlike in the past, the impact of these changes no longer occurs directly within the EU market but is mediated through their effects on the global LNG market.
[1] Throughout the period from March to November 2024, the gas price at the Waha hub in the United States was often negative due to a lack of storage space in facilities connected to the Waha-centered network.
[2] Over the past four years, several articles have been published in PricePedia regarding the determinants of gas prices, which form the basis for the analysis in this article. Among them:
- October 7, 2020: Natural gas prices: differences between quotations and customs prices. Analyzes how fluctuations in financial quotations affect the real price of gas;
- May 31, 2022: Fundamentals of the gas market. Examines the fundamentals of the gas market, such as demand, supply, and geopolitical factors, and delves into the impact of the war in Ukraine;
- October 15, 2022: Gas price at the PSV below 100 euros/MWh. Discusses the dynamics of gas prices at the Italian Virtual Trading Point (PSV) in relation to the war in Ukraine and market behavior;
- March 27, 2023: Natural gas prices return to summer 2021 levels. Analyzes the factors that allowed European gas prices to return to summer 2021 levels at the beginning of 2023;
- April 25, 2024: The gas market situation in April 2024. Summarizes the IEA report on the global gas market in the second quarter of 2024, describing the factors that drove the global gas market in the winter of 2023-2024;
- November 18, 2024: Natural Gas Price Forecast. Compares gas price forecast scenarios from various sources, highlighting the factors that lead all forecasters to draw substantially equivalent scenarios.


