PricePedia Scenario for January 2025
Only an Apparent Calm for Commodity Prices
Published by Pasquale Marzano. .
Forecast Forecast
The PricePedia Scenario has been updated with information available as of January 9, 2025. 2024 ended with a persistently weak dynamic in industrial production, especially in Europe. In addition to inheriting this trend from the past year, the first part of 2025 will be marked by uncertainty originating from trade tensions, currently only announced by the newly elected U.S. president Donald J. Trump, and ongoing geopolitical issues. One example of such tensions occurred in the early days of 2025, affecting the European gas market, with the termination of the agreement for Russian gas transit through Ukraine, pushing the natural gas price quoted at the TTF above 50 euros per MWh.
After growing by an average of +1% over the past two years, industrial production in 2025 is forecasted to grow slightly below +2%, a downgrade from the previously published scenario (see the article).
Do you want to stay up-to-date on commodity market trends?
Sign up for PricePedia newsletter: it's free!
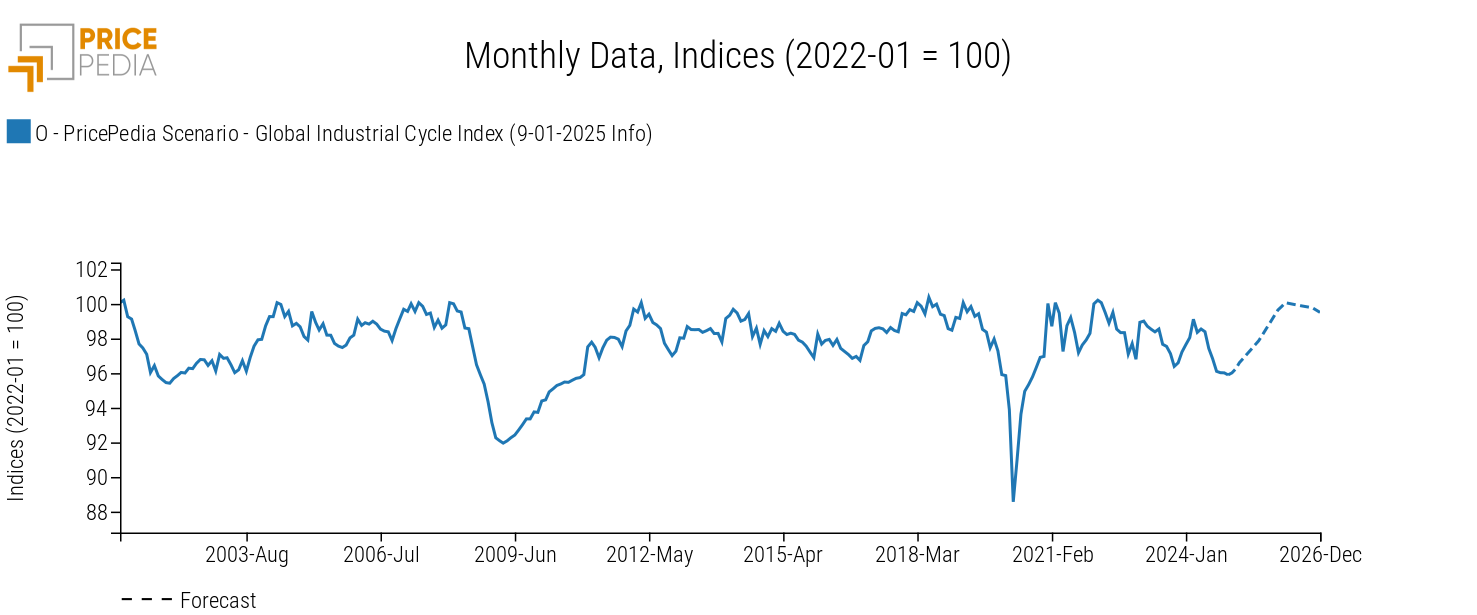
The following graph shows the dynamics of the global industrial cycle index[1], which reflects the trends in industrial production.
Global Industrial Cycle, January 2025 Scenario

After the global industrial cycle recorded an average decline of about half a percentage point in 2024 compared to the previous year, the index is expected to reverse this trend in the coming months. However, the forecasted trend is not strong enough to lead to robust growth already in 2025. Only in the latter part of the year and especially in 2026, a strengthening of global industrial cycle growth rates is expected.
Forecast for Procurement Material Prices
The weak dynamic of the global industrial cycle, and consequently the demand for commodities, is shaping the forecast for raw material prices, especially in the industrial sector.
The table below illustrates the annual price changes in euros for the main commodity aggregates (Industrials[2], Commodity[3], Total Energy, and Total Food).
Table 1: Annual Growth Rates (%) of PricePedia Aggregates Indices, in Euros
| 2023 | 2024 | 2025 | 2026 | |
|---|---|---|---|---|
| I-PricePedia Scenario-Commodity Index (Europe) (9-01-2025 Info) | −18.29 | −4.68 | +0.48 | −0.58 |
| I-PricePedia Scenario-Industrials Index (Europe) (9-01-2025 Info) | −13.88 | −4.34 | +2.56 | +2.70 |
| I-PricePedia Scenario-Energy Total Index (Europe) (9-01-2025 Info) | −23.91 | −6.27 | −3.23 | −3.18 |
| I-PricePedia Scenario-Food Total Index (Europe) (9-01-2025 Info) | −4.95 | +2.57 | +9.02 | +1.18 |
In the next two years, the Commodity Index is expected to remain largely stable at the average 2024 levels. However, this trend results from different factors characterizing individual commodity groups.
Specifically, energy commodities are expected to record a -3.2% decrease in 2025. This decline is less intense than previously forecasted (-3.5%) due to higher natural gas prices in Europe, driven by increased consumption and, most importantly, the EU's continued need to replace Russian gas with LNG or natural gas from other partner countries.
On the other hand, industrial commodities are forecasted to increase by +2.6% in 2025. This increase is downgraded by over half a percentage point from the previous scenario, due to the prolonged weakness in commodity demand described earlier. However, the recovery of the global industrial cycle in 2026 is expected to lead to a more pronounced price increase in this sector, reaching +2.7% (previously +1.4%).
Prices of food commodities are also expected to rise in the next two years, although in this case, variations are more significant compared to industrial commodities. In particular, 2025 is forecasted to see a +9% increase, driven by higher cocoa and coffee prices. For these products, operators expect production reductions to have long-term effects, as highlighted in a previous analysis.
1. The global industrial cycle index is constructed by purifying the actual dynamics of industrial production from its trend. Since the supply of commodities tends to vary according to long-term economic growth expectations, while the demand for commodities is more linked to actual cyclical uses, the global industrial cycle index tends to reproduce the conditions of tension between demand and supply on the commodity market: when it increases, it means that the demand for commodities increases more than the supply; vice versa when it decreases.
2. The PricePedia Industrials index results from the aggregation of the indices relating to the following product categories: Ferrous, Non-Ferrous, Wood and Paper, Chemicals: Specialty, Organic Chemicals, Inorganic Chemicals, Plastics and Elastomers and Textile Fibres.
3. The PricePedia Commodity index results from the aggregation of the indices relating to industrial, food and energy commodities.


