Summary measures of commodity financial markets
How to extract cross-signals to commodity financial price dynamics
Published by Luca Sazzini. .
Range Analysis tools and methodologiesFinancial commodity prices often reflect specific factors linked to their unique characteristics. However, it is reasonable to assume that they are also influenced by dynamics common to larger or smaller groups of commodities.
One method to identify and measure these common factors is through the use of aggregated indices, calculated as the average of prices of a set of commodities considered homogeneous. Generally, markets for metals, energy commodities, and agricultural or food commodities are separated. This distinction is based on the influence of factors deemed common to each group: for example, metals are often influenced by expectations about economic cycles, while agricultural commodity prices largely depend on weather forecasts and their potential effects on agricultural production.
These aggregated indices are thus used to capture the presence of cross-sectional factors that contribute to determining the price trends of different commodities.
In this article, we will focus on extracting additional information derived from processing a wide dataset of financial commodity prices. Specifically, we will delve into three key aspects:
- The prevalence of trends (positive or negative) observed in different prices, as an indicator of market impulses generated by speculators adopting trend-following strategies;
- The spread of backwardation situations in future prices, considered a measure of the cross-sectional expectations of price reductions;
- The dispersion of price variations, seen as an indicator of prevailing uncertainty in financial commodity markets.
Trend following
The development of financial markets has highlighted the dominance of technical analysis tools as sources of information supporting speculators' decisions.
Among the technical analysis tools that have achieved some success in commodity markets, a significant role is played by trend-following strategies. These strategies are based on analyses capable of measuring price trends and signaling the approach of a reversal phase. If no indications of possible reversals are present, then, according to this strategy, the probability of earning profits by buying (selling) assets whose prices show an upward (downward) trend is high. Since these analyses can be replicated for all financial commodity prices, it is possible to attribute to each price, at any time, its status in terms of the trend being followed: upward, downward, or uncertain.
The global commodity trend index, developed by PricePedia, measures the total number of upward and downward trends observed among different commodities on a given day. This index allows the determination of which decisions will predominantly be made by speculators following "trend-following" strategies.
A positive index value indicates a predominance of upward trends in the commodity market, while a negative value reflects a prevalence of downward trends.
Below is the chart of the global commodity trend index developed by PricePedia.
Global Commodity Trend Index
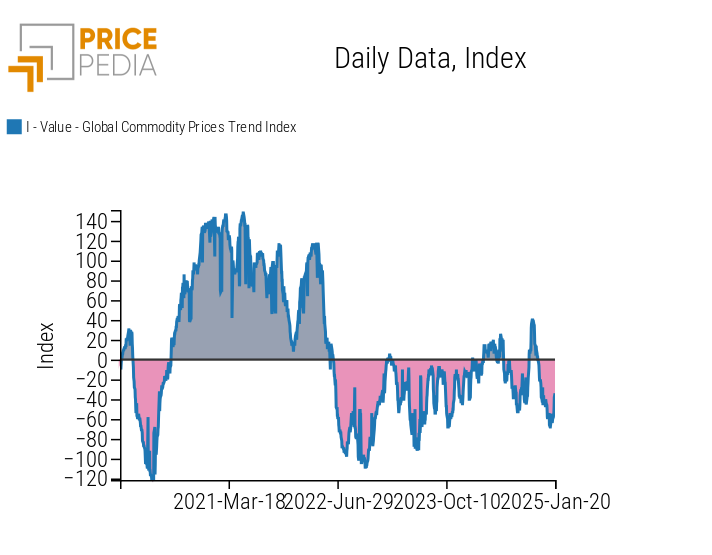
The chart highlights in pink the phases characterized by a prevalence of downward trends and in gray those dominated by upward trends. Since the current index value is below zero, it indicates that traders adopting trend-following strategies are exerting, ceteris paribus, downward pressure on commodity prices.
Do you want to stay up-to-date on commodity market trends?
Sign up for PricePedia newsletter: it's free!
Price reduction expectations
A market is defined as being in backwardation when the spot prices of the underlying are higher than their respective future prices. This phenomenon suggests that financial operators expect future spot prices to decline. Otherwise, sellers would not be willing to agree today to sell a product in the future at a price lower than the current market price.
To have a comprehensive measure of backwardation situations within the commodity market, PricePedia has developed the Global Backwardation Commodity Index, charted below.
Global Backwardation Commodity Index
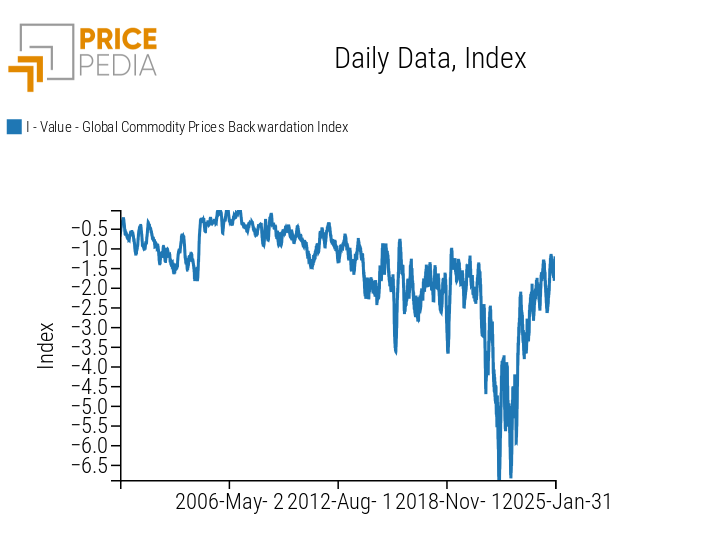
The index can only take on negative values and is zero when no price is in a backwardation situation. As the negative values increase (in absolute terms), the index signals an increase in cases of backwardation within the commodity market.
Currently, the index shows that the 2021–2022 biennium was the period with the highest number of backwardation situations. Since then, backwardation cases have gradually decreased, returning to levels recorded in 2020.
Uncertainty in commodity markets
In finance, a measure of volatility associated with a single financial asset is generally used to measure the uncertainty of its returns over time. Higher asset volatility implies greater uncertainty in its returns: it may generate high profits but also high losses.
There are also volatility measures that refer to a set of assets to measure the expected turbulence in their returns. For example, the Chicago Board Options Exchange (CBOE) Volatility Index measures the uncertainty of the expected returns of the S&P 500 components.
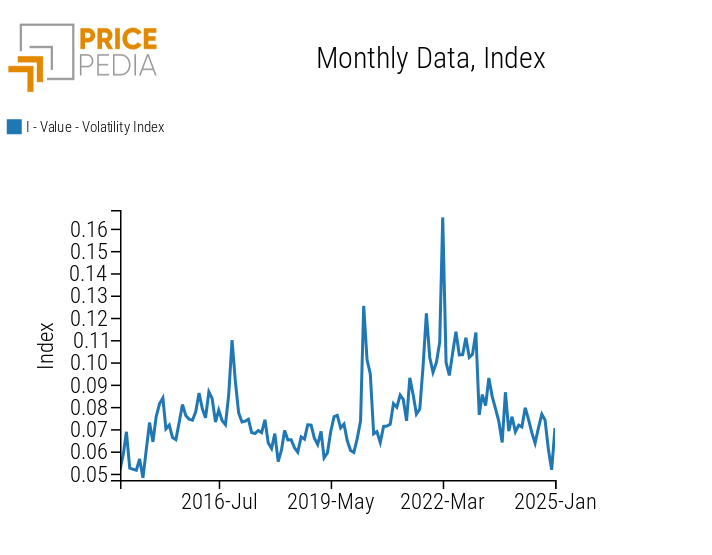
Extrapolating the concept of volatility from a group of financial assets to a group of commodity prices, PricePedia has developed a volatility index that measures the uncertainty weighing, at a given time, on the price dynamics of commodities. It is based on the dispersion between price changes among various commodities. Specifically, the greater the magnitude of price changes in opposite directions among commodities, the higher the volatility index value.
This index also incorporates the concept of uncertainty related to significant commodity price changes. For instance, if all commodities record identical but intense price changes at a specific historical moment, the volatility index will still not be null, as it accounts for uncertainty linked to strong price changes.1
The chart below shows the volatility index developed by PricePedia.
PricePedia Commodity Market Volatility Index
Conclusions
The availability of a wide set of financial prices recorded daily allows the definition of indicators that capture cross-sectional factors for large groups of prices. This can be done by defining aggregated indices that group the average dynamics of multiple prices into a single index.
Additionally, other indices can be developed to extract information from commodity price dynamics, such as:
- Probable effects on prices from trend-following strategies adopted by speculators;
- A measure of the relevance of cases where financial operators expect price reductions;
- A measure of the degree of uncertainty about the future price evolution affecting financial commodity markets at a given time.
[1] From a technical point of view, the index is constructed in such a way that if the first and last quantiles experience price changes of the same sign, the smaller change in absolute value will be considered zero. This ensures that the dispersion between the change in the other quantile and the null value still remains high, preventing the index from reaching a value of zero.
