Monthly commodity prices update for January 2025
Differentiated signals of commodity price recovery
Published by Pasquale Marzano. .
Last Price Global Economic TrendsThe monthly update of PricePedia commodity prices for January 2025 has been published. In aggregate terms, the first month of the year recorded price increases of +4.2% compared to December 2024.
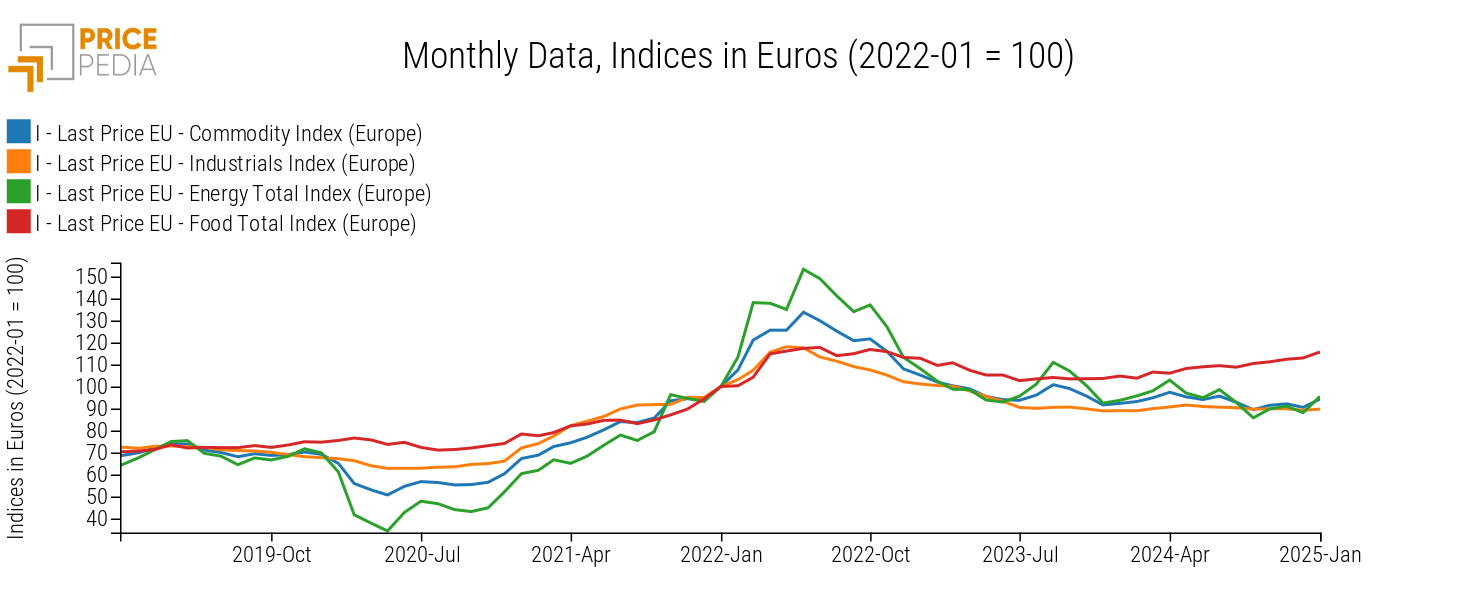
The following chart shows the price trends of raw materials in Europe for the main PricePedia aggregates: Commodity[1], Industrials[2], Energy Total, and Food Total, with January 2022 levels as the base (100).

The most significant growth was recorded in the euro prices of energy commodities, which increased by +8.4% compared to December 2024, driven among others by oil (+9.2%) and gas oils containing biodiesel (+14.4%). The price of natural gas also rose due to several factors that led to a rapid depletion of European gas stocks (see the in-depth analysis Determinants of European gas price at 50 euros/MWh).
Regarding food commodities, prices of tropical goods such as cocoa and coffee continue to drive the sector's growth trend, although some goods have seen significant declines, such as extra virgin olive oil (-14.8% compared to December 2024).
The recovery signals for industrial commodities are still too weak (+0.6% compared to the previous month) to indicate a real trend change from the lateral movements observed for several months, caused by the weakness of global manufacturing.
Additional downward pressure could emerge in the coming months due to growing trade tensions between the United States and partner countries. Currently, President Trump, through an executive order, has imposed 25% tariffs on U.S. imports from Canada and Mexico, increased tariffs on China by an additional 10%, and expressed willingness to introduce tariff measures against Europe. All else being equal, the U.S. protectionist policy will tend to translate into upward price pressure in the U.S. market and downward pressure in other markets.
Focus on commodity prices by sector
The graph below shows the changes recorded in January 2025 compared to the previous month for euro-denominated prices of the main sectors available in PricePedia.
Graph 2: January 2025, % variations in euros compared to December 2024
Source: PricePedia
In addition to energy commodities, euro prices of precious metals also saw significant growth of over +7% compared to December 2024.
Products in Inorganic Chemicals, Specialty Chemicals, Non-Ferrous Metals, and Pharmaceutical Chemicals showed aggregated increases ranging between +1% and +2%, while the remaining sectors remained largely stable.
Do you want to stay up-to-date on commodity market trends?
Sign up for PricePedia newsletter: it's free!
Medium-term trends
The following chart illustrates the year-over-year changes in euro prices recorded in January 2025 compared to the same month of the previous year.
Graph 3: January 2025, % variations in euros compared to January 2024
Source: PricePedia
Compared to January 2024, euro price levels have increased for most sectors. However, this growth is heterogeneous in intensity: from the increases in Precious Metals (+31%) to the less intense growth of Food products (+10.5%) and the more modest rise in Pharmaceutical Chemicals (+1.3%).
For sectors with negative or zero growth rates, it is worth noting that this trend is driven by downward pressure in the Chinese market.
In this regard, the table below shows the annual percentage changes of aggregated indices in euros for the European and Chinese markets, covering Ferrous Metals, Inorganic Chemicals, Organic Chemicals, and Plastics and Elastomers.
Table 1: Europe vs. China. Annual Growth Rates (%) of PricePedia Aggregates Indices, in Euros
| 2021 | 2022 | 2023 | 2024 | |
|---|---|---|---|---|
| I-Last Price EU-Ferrous Metals Total Index (Europe) | +47.94 | +20.26 | −15.45 | −7.10 |
| I-History China FOB-Ferrous Metals Total Index (China) | +37.98 | +15.37 | −21.35 | −14.67 |
| I-Last Price EU-Inorganic Chemicals Total Index (Europe) | +11.91 | +63.14 | −7.66 | −11.00 |
| I-History China FOB-Inorganic Chemicals Total Index (China) | +34.14 | +47.27 | −22.93 | −9.61 |
| I-Last Price EU-Organic Chemicals Total Index (Europe) | +46.07 | +29.88 | −18.67 | −2.54 |
| I-History China FOB-Organic Chemicals Total Index (China) | +57.23 | +13.81 | −24.94 | −6.41 |
| I-Last Price EU-Plastics and Elastomers Total Index (Europe) | +38.26 | +22.07 | −16.46 | −3.79 |
| I-History China FOB-Plastics and Elastomers Total Index (China) | +16.31 | +16.42 | −21.28 | −7.83 |
From the table, it is evident that the price surge of 2021-2022 was primarily driven by European prices, with variations almost always exceeding those recorded by Chinese indices (except for Inorganic Chemicals).
During the subsequent biennium of 2023-2024, the price reduction trend was instead led by Chinese prices.
1. The PricePedia Commodity index is the aggregation of Industrials, Food and Energy indices.
2. The PricePedia Industrials index is the aggregation of indices related to the following categories: Ferrous Metals, Non-Ferrous Metals, Wood and Paper, Pharmaceutical Chemicals, Chemicals: Specialty, Organic Chemicals, Inorganic Chemicals, Plastics and Elastomers, and Textile Fibers.


