The evolution of PricePedia: innovations and benefits for Procurement
New product categories, datasets and analytical tools to tackle global challenges
Published by Luca Surace. .
Strumenti Analysis tools and methodologiesThe PricePedia project was launched in 2018 with the goal of creating a platform dedicated to monitoring and analyzing the prices of commodities and semi-finished goods, based on customs (Eurostat source) and financial data. From the start, innovation has been the driving force behind the development of PricePedia, with the continuous introduction of new features, datasets, and analytical tools.
In recent years, PricePedia's innovation has specifically developed along three main directions:
- expansion of product coverage, improvement of price measures, and development of new forecasting models;
- integration of new datasets, with complementary information to EU customs and financial source prices;
- evolution of analysis and visualization tools, to transform data into strategic insights to support Procurement professionals.
This article aims to illustrate the main innovations introduced in PricePedia in recent years, highlighting the benefits for those operating in the procurement world.
Do you want to stay up-to-date on commodity market trends?
Sign up for PricePedia newsletter: it's free!
1. Expansion of product coverage, enhancement of price measures, and development of new forecasting models
In recent years, PricePedia's product coverage has expanded significantly, increasing from around 100 to over 1,000 monitored products. This expansion involved:
- a higher level of detail within the already monitored product categories, allowing for a greater match between the products purchased by companies and those monitored on the platform;
- the addition of new product groups, enabling companies purchasing a wide variety of raw materials to monitor them all in one place, simplifying comparisons between alternative materials and offering a broader and more detailed view of market dynamics.
At the same time, price measures have been refined and diversified to meet specific analytical needs. For each EU customs price, for example, it is now possible to access:
- timely data related to contracts negotiated during the reference month ("Last Price EU" measure), useful for providing the most up-to-date view of market trends;
- measurements that, although less timely, offer maximum objectivity ("Historic EU" measure), as they are calculated exclusively using EU countries’ customs declarations;
- data that is not subject to revisions in historical observations ("Last Price not revised" measure), essential for indexing supply contracts, adjusting price lists, or conducting retrospective analyses without the risk of subsequent data revisions;
- measurements of price dispersion (minimum and maximum), which allow for the assessment of a product's potential differentiation and, consequently, the possibility that, within a given time period, the product is traded at different prices.
Another significant update in terms of expanded price measures involves financial prices. In addition to the continuous contract, quotes for different available maturities have been introduced.
The continuous contract is a historical series linking the prices of successive futures contracts (e.g., "May 2025 Delivery", "July 2025 Delivery", "September 2025 Delivery", etc.), eliminating discontinuities due to the expiration of individual contracts and allowing for long-term trend analysis. However, to achieve a more detailed market reading, PricePedia also includes prices for individual contracts, providing even more specific information on market sentiment regarding price trends for each contract.
Lastly, the forecasting component has been significantly enhanced by expanding the forecasting models, now encompassing about 300 interconnected equations specific to each product and based on a unified scenario. This setup not only enables more accurate estimation of future price trends but also captures complex dynamics among economic, financial, and market variables. The interconnected equations promote a holistic approach to forecasting, ensuring greater internal consistency of results and minimizing the risk of discrepancies.
2. Integration of new datasets
In today's context, monitoring a commodity's price solely within the EU market can be limiting and potentially misleading. Commodity markets often have a global dimension, and what happens in other geographic areas, such as the United States or China, can anticipate or significantly influence European dynamics. For this reason, PricePedia has gradually expanded its coverage in recent years by incorporating customs prices from the USA and China, allowing for more accurate and strategic global monitoring.
This integration not only broadens the view of ongoing dynamics but also reinforces the information from the EU market. When price observations from three different markets indicate the same trend (e.g., an increase or decrease in prices), the detected signal becomes more robust and reliable, reducing the risk of decisions based on isolated or incomplete information. At the same time, observing differing trends across markets can be a crucial signal: discrepancies between EU, US, and Chinese prices may indicate the presence of regional markets, transitory phenomena (such as logistical delays or specific supply constraints), or foreshadow future changes in the European market.
In addition to customs data, PricePedia has been enriched with other datasets, providing comprehensive and detailed market dynamics analysis. Among them are EU producer prices, which allow for analyzing European producers' costs and anticipating potential downstream price changes along supply chains.
Additionally, the platform constantly integrates information on key variables such as shipping rates, gas inventories, exchange rates, and other economic and financial indicators. These complementary data points can help capture underlying factors affecting prices, such as supply chain disruptions or energy shocks, and forecast possible market developments (e.g., a reduction in gas inventories can signal tensions in energy and raw material prices).
Thanks to this continuous data integration, PricePedia enables Procurement professionals to benefit from a broad and strategic view, useful for detecting timely signals, interpreting price movements' causes, and predicting future scenarios with greater confidence.
3. Evolution of analytical and visualization tools
One of PricePedia's fundamental objectives, in addition to providing accurate data on commodity and semi-finished goods prices, has always been to offer an analytical environment that transforms data into strategic information to support business decisions. This goal has been realized through enhancements to traditional visualization tools, such as charts and tables, as well as the introduction of advanced analytical tools designed to meet more personalized and sophisticated needs.
Among the particularly innovative tools is the Forecast tool, which allows for building customized forecasting models and testing their accuracy and reliability. Another noteworthy tool is the Regression feature within the Price Data environment, which, through advanced econometric techniques, analyzes the relationships between different price series and identifies their determinants.
In recent years, innovation in analysis and visualization tools has focused on three main areas of development:
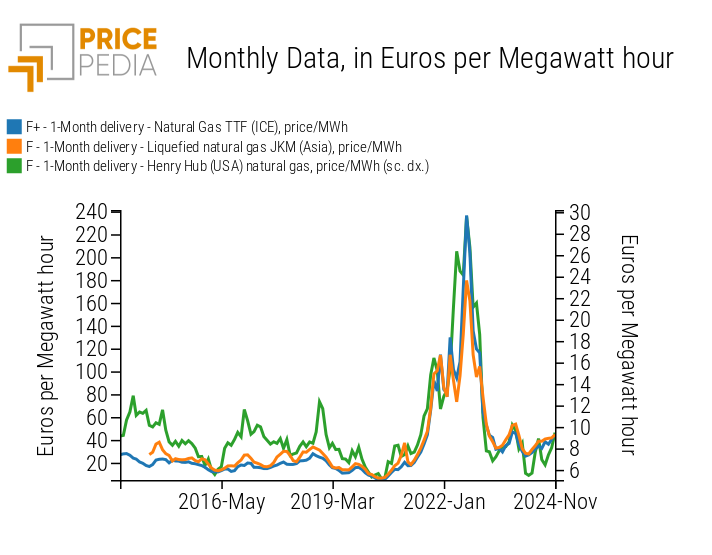
- features supporting graphical analysis, such as color shading between two series to highlight periods when one series is above or below the other, the ability to insert a constant to represent reference thresholds, or the use of dual scales to effectively compare series with different variability without visual distortions;
- features supporting tabular analysis, which allow for manipulation and customization of the table's structure;
- tools for transforming historical series, enabling, for example, the calculation of moving averages or the removal of inflation effects from price series.
Overall, all these features aim to provide users with advanced data control, facilitating the identification of trends, critical points, and key dynamics, and allowing for customized analyses to meet specific needs.
Conclusions
From the outset, innovation has driven PricePedia's development, guiding its evolution toward a more complete and sophisticated platform. The expansion of product coverage, the introduction of new datasets, and the continuous improvement of analytical tools are not final goals but milestones in a journey focused on constantly adapting to users' needs and requirements.
Through innovation, PricePedia has transformed into a dynamic working environment where data, models, and tools integrate to provide users with a deeper understanding of market dynamics. This approach ensures that the platform continues to evolve, keeping pace with changes and offering new solutions to address future challenges.
You may be interested in:

The Globalization of Commodity Markets
Published by Luigi Bidoia. .
Strumenti Analysis tools and methodologiesMarket forces in Europe and Asia tend to produce a single price between the two markets [ Read all ]
The dual scale chart: a tool to analyze the prices of purchased materials
Published by Pasquale Marzano. .
Strumenti Analysis tools and methodologiesNew data visualization feature in PricePedia [ Read all ]

Critical raw materials: tellurium market risk analysis
Published by Luca Sazzini. .
Strumenti Critical raw materialsTellurium has the highest market risk among the more than 700 commodities monitored by PricePedia [ Read all ]