Trump's tariffs: more wrestling than boxing?
Trump's tariffs look more and more like a weapon of negotiating pressure rather than part of a clear trade policy strategy
Published by Luca Sazzini. .
Conjunctural Indicators Commodities Financial WeekSince the beginning of his term, President Donald Trump has adopted a trade strategy based on announcements and tariff threats, often used as a negotiating pressure tool rather than definitive measures. This week, market attention focused on new tariff moves, which, however, were perceived more as a negotiation tactic rather than the start of a real trade escalation. The result was a containment of concerns and greater confidence that tensions could ease before having a significant economic impact.
In this context, China has formalized a complaint with the World Trade Organization (WTO) against the latest U.S. measure: a 10% tariff on some Chinese imports and the removal of the exemption for low-value packages. With the elimination of the "de minimis" threshold, U.S. customs authorities will now require customs documentation even for shipments valued under $800, with the risk of merchandise being returned in case of incomplete documentation.
Beijing responded by imposing tariffs of 15% on coal and natural gas and 10% on oil, agricultural equipment, and some American cars. However, the fact that these measures will take effect only after February 10 confirms the negotiable nature of the move, leaving room for possible compromises.
Not only China, but also Canada and Mexico have reacted to U.S. tariff policies. Canada announced new 25% tariffs on various categories of U.S. goods, while Mexico stated that it would adopt equivalent retaliatory measures to protect its economy. In response, the United States opted for a temporary suspension of sanctions on the two countries for 30 days, highlighting the intention to keep dialogue channels open.
The eurosopean Union remains on standby, aware that it could be the next target of the Trump administration’s tariffs. Brussels has reiterated its willingness to respond firmly to any new tariffs, emphasizing that such measures will ultimately penalize both economies.
Weekly Summary of Financial Commodity Prices
Despite trade tensions, markets reacted with greater optimism, interpreting Trump’s moves as a pressure strategy rather than a real economic threat. Commodity prices, particularly industrial metals, rose mainly due to a more positive-than-expected start to the Chinese New Year.
Gold continued to be a safe haven asset, supported by global uncertainties, while ferrous and non-ferrous metals benefited from expectations of a recovery in Chinese industrial demand.
In the energy sector, prices initially rose on Monday but later corrected downward after the U.S. decision to suspend tariffs on Canada and Mexico for 30 days, signaling that the market does not foresee an imminent escalation of the trade war.
In the food sector, grain and oil prices followed an upward trend, while tropical commodities experienced a decline, mainly driven by falling cocoa prices.
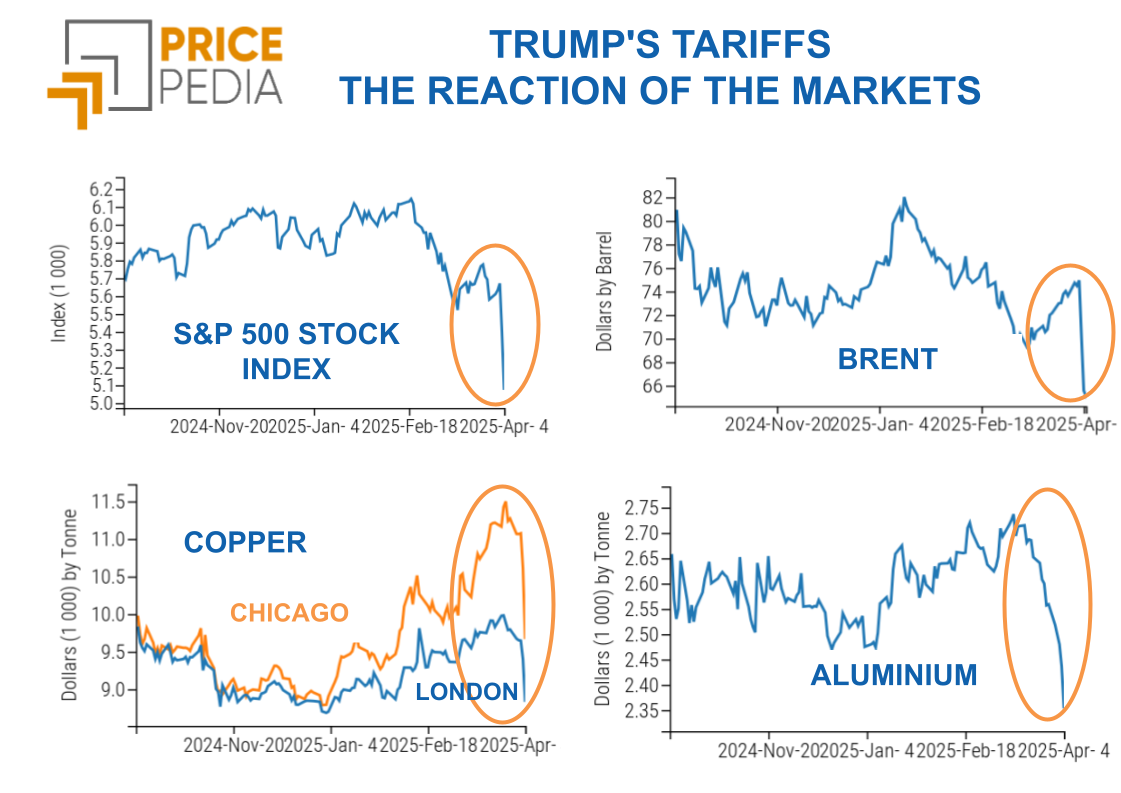
Tariff effects were instead felt in the U.S. market, with prices on the Chicago Mercantile Exchange (CME) rising, reflecting expectations of an impact on domestic price dynamics in the United States. This phenomenon is evident when comparing copper price indices traded in Chicago (CME), London (LME), and Shanghai (SHFE), showing a divergence among markets that reflects differing perspectives on the effects of U.S.-imposed tariffs.
Copper Price Index on Financial Markets

eurosozone Inflation
The euroso area’s Consumer Price Index (CPI) signaled inflation growth in January exceeding analysts’ expectations.
Headline inflation increased by 2.5% annually, compared to 2.4% the previous month and analysts’ forecasts. On a monthly basis, there was a decrease of 0.3%, in line with expectations.
The core index remained stable at 2.7%, contrary to forecasts of a slight decline by one-tenth of a percentage point. Among the sectors that contributed most to price growth, energy recorded a significant increase both on a monthly (+2.9% m/m) and annual (+1.8% y/y) basis. Prices of non-energy industrial goods remained stable annually (0.5% y/y) but saw a significant monthly decline of -2.4% m/m.
Service prices remain high, though they have shown moderation. On a monthly basis, there was a decline of -0.2% m/m, while annual growth fell by one-tenth of a point to 3.9%.
The country that surprised the most on the upside in terms of inflation was Italy, with a rise in the headline index and the EU harmonized index of 1.5% y/y and 1.7% y/y, compared to 1.3% and 1.4% recorded the previous month.
Despite the higher-than-expected eurosopean inflation growth, no changes to the currently expansive monetary policy of the ECB are expected. It is believed that the persistent weakness in euroso area demand will continue to drive price growth deceleration in the coming months.
ENERGY
The PricePedia energy product index recorded an increase on Monday, only to decline following the U.S. suspension of tariffs on Canada and Mexico.
The drop was further reinforced by new U.S. crude oil inventory data, which exceeded expectations.
PricePedia Financial Index of Energy Prices in dollars

The energy heatmap shows a decline in oil prices, while natural gas prices in eurosope and the U.S. have risen, driven by expectations of higher eurosopean gas demand in the coming months to replenish currently depleted reserves.
Energy Price HeatMap in eurosos

PLASTIC MATERIALS
The PricePedia index for financial prices of plastics and elastomers follows a downward trend, in line with oil price movements.
PricePedia Financial Indices of Plastic Prices in dollars

FERROUS METALS
The indices for ferrous metals in the eurosopean and Chinese markets both show a price increase, driven by expectations of a more robust recovery of the Chinese industry.
PricePedia Financial Indices of Ferrous Metal Prices in dollars

The heatmap for ferrous metals shows an increase in prices for iron ore in China, steel scrap in Turkey, and especially hot-rolled coils (HRC) in eurosope and the USA.
HeatMap of Ferrous Metal Prices in euros

Do you want to stay up-to-date on commodity market trends?
Sign up for PricePedia newsletter: it's free!
NON-FERROUS INDUSTRIAL METALS
The financial indices for non-ferrous metals are both following price increases, supported by improved expectations for the Chinese industry.
PricePedia Financial Indices of Non-Ferrous Industrial Metal Prices in dollars

The heatmap analysis shows a general increase in non-ferrous metal prices.
HeatMap of Non-Ferrous Metal Prices in euros

FOOD COMMODITIES
The food commodity indices for cereals and edible oils are showing price increases, while the tropical commodities index experiences a downturn.
PricePedia Financial Indices of Food Commodity Prices in dollars

CEREALS
The heatmap for cereals shows a weekly increase in the prices of oats and wheat.
HeatMap of Cereal Prices in euros

TROPICAL COMMODITIES
The heatmap for tropical commodities shows a significant reduction in cocoa prices, alongside an increase in Arabica coffee prices.
HeatMap of Tropical Commodity Prices in euros

OILS
The heatmap for oils highlights a growth in rapeseed oil prices.
HeatMap of Edible Oil Prices in euros

You may be interested in:

Transfer of US-China tensions from trade to financial flows
Published by Luca Sazzini. .
Conjunctural Indicators Commodities Financial WeekMarkets under stress: how Trump's tariffs affect financial price fluctuations [ Read all ]
Liberation or Ruination Day? A storm of tariffs on commodity markets
Published by Luca Sazzini. .
Conjunctural Indicators Commodities Financial WeekFinancial markets fail U.S. protectionist policy [ Read all ]

Commodities in check since Trump's annnucials
Published by Luca Sazzini. .
Conjunctural Indicators Commodities Financial WeekFaced with uncertainty, investors find refuge in gold [ Read all ]