PricePedia Scenario for February 2025
With few exceptions, prices remain stable or slowly decreasing, with a higher risk of further declines
Published by Pasquale Marzano. .
Natural Gas Forecast Forecast
The PricePedia Scenario has been updated with information available as of February 5, 2025. The trade policy of Trump's second term is gaining momentum, with the first measures announced—and then suspended—against major trading partners (see Trump's tariffs: more wrestling than boxing?).
The ongoing trade tensions tend to increase uncertainty regarding the timing of the global commodity demand recovery.
In terms of global industrial production, which represents the worldwide demand for raw materials, after a 2024 that saw growth of just over +1%, the baseline scenario for 2025 forecasts growth above +2%, with potential downside risks if trade relations between countries deteriorate.
Do you want to stay up-to-date on commodity market trends?
Sign up for PricePedia newsletter: it's free!
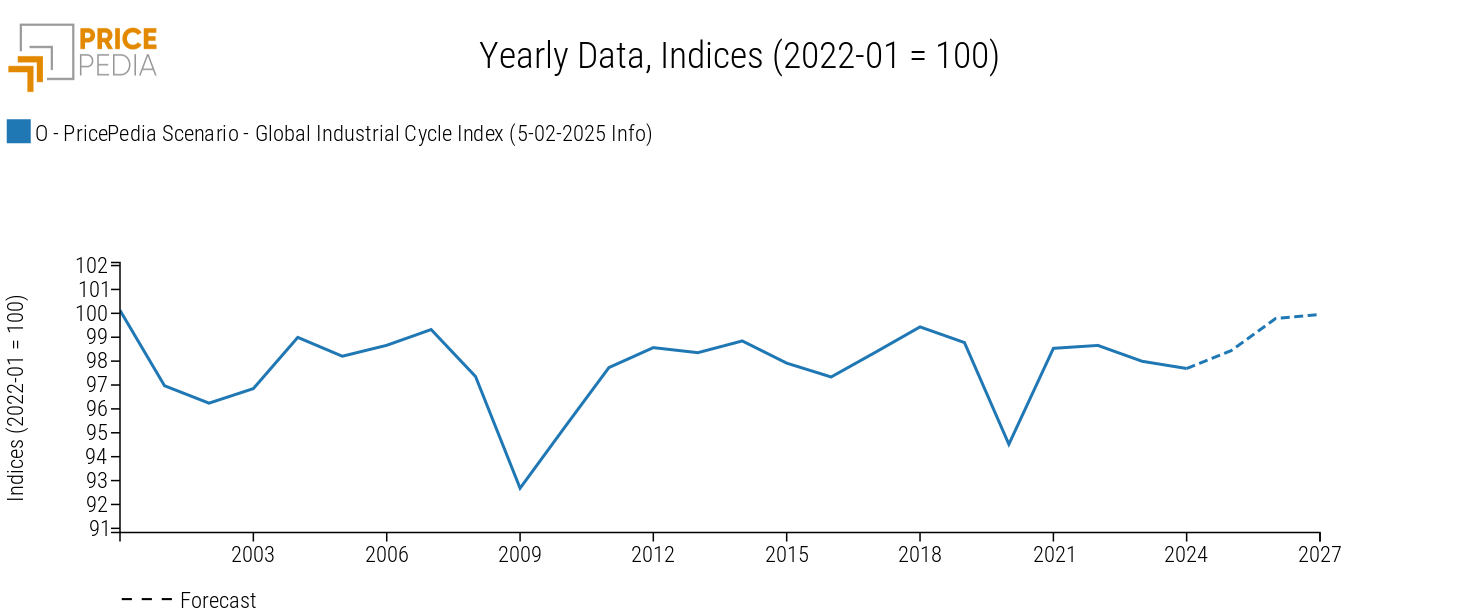
The following graph shows the dynamics of the global industrial cycle index[1], which reflects the trends in industrial production.
Global Industrial Cycle, February 2025 Scenario

In 2024, the industrial cycle remained below the average level recorded in 2023, continuing the downward trend that has characterized it since 2022, due to the slowdown in global manufacturing activity. In the 2025-2026 period, the cycle is expected to recover, with average growth rates exceeding +1%.
Forecast for Procurement Material Prices
The increased uncertainty regarding the recovery of commodity demand negatively impacts, in particular, euro-denominated prices of industrial commodities.
The table below illustrates the annual percentage changes in euro prices of the main commodity groups (Industrial[2], Total Commodity[3], Total Energy, and Total Food).
Table 1: Annual Variation Rates (%) of PricePedia Aggregated Indices, in Euro
| 2023 | 2024 | 2025 | 2026 | |
|---|---|---|---|---|
| I-PricePedia Scenario-Commodity Index (Europe) (5-02-2025 Info) | −18.27 | −4.58 | +0.17 | −1.27 |
| I-PricePedia Scenario-Industrials Index (Europe) (5-02-2025 Info) | −13.85 | −4.27 | +1.80 | +2.03 |
| I-PricePedia Scenario-Energy Total Index (Europe) (5-02-2025 Info) | −23.88 | −6.13 | −3.11 | −4.13 |
| I-PricePedia Scenario-Food Total Index (Europe) (5-02-2025 Info) | −5.47 | +2.49 | +13.80 | +0.95 |
After an annual decline of -4.6% in 2024, in aggregate, euro-denominated commodity prices are expected to remain at 2024 levels in 2025, supported by the cumulative increase in food prices throughout 2024, particularly cocoa and coffee. The downward trend resumes in 2026, when the index is expected to decline by -1.3%.
Although industrial commodities experienced a price decline similar to the total commodity index in 2024, prices are expected to rise in 2025 and 2026 by +1.8% and +2%, respectively. This growth is less intense than what was projected in the previous scenario. However, it should be noted that the current scenario does not incorporate Trump's announced protectionist policy, as its implementation details are unknown and it is increasingly likely to serve as a negotiation tool rather than a radical shift in U.S. trade policy.
Regarding food commodities, a double-digit percentage increase is expected in 2025, driven by anticipated price hikes (largely already in effect) in tropical goods and vegetable oils. In 2026, the growth rate is expected to moderate, falling below 1%.
For energy commodities, prices are expected to decline at an average annual rate of over -3% over the next two years.
Within the energy sector, the different trend of European natural gas is noteworthy. In early February, its price surged well above 50 euros per MWh. Although this level is far from the historical highs of 2022, it remains elevated, especially compared to pre-pandemic values. On an annual basis, 2025 is expected to close with a price increase of over +33%.
The table below presents the percentage changes in TTF natural gas prices in euro compared to the 2019 average.
Table 2: Natural Gas, % Change Compared to 2019, in Euro
| 2020 | 2021 | 2022 | 2023 | 2024 | 2025 | 2026 | 2027 | |
|---|---|---|---|---|---|---|---|---|
| Variation compared to 2019 | −34.41 | +221.66 | +799.29 | +182.53 | +136.05 | +216.14 | +158.74 | +143.11 |
What emerges from the table is a persistent high price level compared to the pre-pandemic period. In 2025, prices are more than +200% higher than in 2019, when they were below 15 euros per MWh. Even in 2026, natural gas prices are expected to remain high, although declining by -18% compared to the previous year.
1. The global industrial cycle index is constructed by purifying the actual dynamics of industrial production from its trend. Since the supply of commodities tends to vary according to long-term economic growth expectations, while the demand for commodities is more linked to actual cyclical uses, the global industrial cycle index tends to reproduce the conditions of tension between demand and supply on the commodity market: when it increases, it means that the demand for commodities increases more than the supply; vice versa when it decreases.
2. The PricePedia Industrials index results from the aggregation of the indices relating to the following product categories: Ferrous, Non-Ferrous, Wood and Paper, Chemicals: Specialty, Organic Chemicals, Inorganic Chemicals, Plastics and Elastomers and Textile Fibres.
3. The PricePedia Commodity index results from the aggregation of the indices relating to industrial, food and energy commodities.


