Towards a More Integrated Eurasian Gas Market
The 2022 energy crisis has accelerated the interconnection between Europe and Asia
Published by Luigi Bidoia. .
Natural Gas Price DriversIn January, the International Energy Agency (IEA) published the Gas Market Report, Q1-2025, providing an in-depth analysis of 2024 market trends and a short-term outlook for 2025.
One of the key findings of the report is that gas supply conditions will remain tight in 2025,supporting prices and limiting global demand growth. High prices will continue to be a barrier to the energy transition, slowing the shift from coal and oil to natural gas.
Convergence of European and Asian gas prices
A significant trend highlighted in the report is the increasing correlation between European gas prices (TTF) and liquefied natural gas (LNG) prices for Japan and South Korea (JKM). Over recent years, volatility has surged in both markets, yet the correlation between TTF and JKM prices has reached a historic high of 0.95, reflecting a growing interconnection between the two regions.
This price alignment is mainly driven by the rise of flexible LNG supplies, which allow cargoes to change destinations while in transit, and by the growing share of LNG in Europe’s gas imports. In some months of 2023, LNG imports into the EU surpassed pipeline gas imports, whereas before 2019, LNG accounted for less than a quarter of total European gas imports.
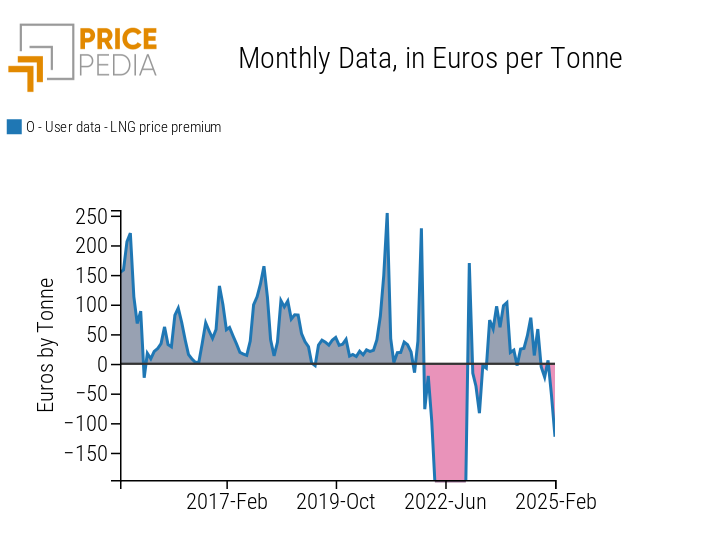
From a financial perspective, this trend is confirmed by the evolution of the LNG price premium, calculated as the difference between JKM and TTF prices, as shown in the graph below.
Liquefied Natural Gas (LNG) price premium over TTF gas price

Before the European gas crisis, the LNG price premium over TTF was consistently positive, often exceeding 150 euros/ton and, in some cases, surpassing 200 euros/ton—representing a differential of more than 50% compared to TTF prices. Even after the 2022 crisis and up to the onset of the new 2025 crisis, the premium remained positive, but with a much smaller maximum differential, never exceeding 100 euros/ton or 15% of the TTF price. This confirms that, since 2023, the two prices have been moving in closer alignment.
However, this convergence in gas financial prices could result from two different dynamics: actual integration of physical markets or financial arbitrage activities. If the alignment is driven by deeper integration of physical markets, it suggests the formation of a single, unified gas market between Europe and Asia. In this scenario, any change in global gas supply will be simultaneously reflected in prices in Europe and Asia, just as an increase in Asian demand will tend to directly influence European prices, and vice versa
Do you want to stay up-to-date on commodity market trends?
Sign up for PricePedia newsletter: it's free!
Convergence of physical prices
To assess the degree of physical market integration, the following table presents the physical import prices of liquefied natural gas and pipeline gas in Europe, Asia, and North America. Additionally, for a more comprehensive market perspective, the table includes the prices of the three main global financial gas indices.
Gas Prices by Market and Type
| 2019 | 2020 | 2021 | 2022 | 2023 | 2024 | |
| Financial Market Prices | ||||||
| Natural Gas Henry Hub-USA (NYMEX) | 126 | 103 | 176 | 348 | 137 | 124 |
| Natural Gas TTF-Netherlands (ICE) | 239 | 157 | 779 | 2168 | 674 | 565 |
| LNG JKM-Asia (CME) | 268 | 195 | 826 | 1751 | 718 | 587 |
| Physical Market Prices | ||||||
| USA Natural Gas Imports (USA CIF) | 131 | 109 | 189 | 338 | 194 | 96 |
| USA Natural Gas Exports (USA FOB) | 140 | 116 | 200 | 320 | 143 | 125 |
| USA LNG Exports (USA FOB) | 241 | 259 | 351 | 557 | 354 | 293 |
| CHINA Natural Gas Imports (China CIF) | 360 | 292 | 278 | 388 | 401 | 383 |
| EU Customs Natural Gas | 275 | 196 | 597 | 1519 | 697 | 582 |
| EU Customs LNG | 301 | 220 | 619 | 1321 | 725 | 552 |
| CHINA LNG Imports (China CIF) | 472 | 365 | 508 | 789 | 629 | 572 |
| JAPAN LNG Imports (Japan CIF) | 530 | 436 | 453 | 826 | 776 | 629 |
In the table, the two financial prices and four physical prices representing the integration area between the European and Asian markets are highlighted in blue. These prices include:
- Financial Market Prices:
- European TTF natural gas price
- Asian JKM liquefied natural gas (LNG) price
- Physical Market Prices:
- EU pipeline natural gas import price
- EU liquefied natural gas import price
- China liquefied natural gas import price
- Japan liquefied natural gas import price
A comparison of these six prices shows a significant narrowing of price differences in 2023 and, even more so, in 2024. While in the 2019-2021 period the annual average standard deviation between these prices exceeded 100 euros/ton, it declined to 61 euros/ton in 2023 and dropped further to 32 euros/ton in 2024.
Conclusions
The 2022 European gas crisis, coupled with the increasing share of liquefied natural gas in EU imports, has led to a growing alignment between the financial prices of European TTF and Asian JKM. This financial alignment has been accompanied by a real market integration, resulting in the emergence of a single LNG price across the entire Eurasian market, which also includes pipeline gas imported into the EU.
The existence of this broad Eurasian natural gas market has two key implications:
- Price levels: In the medium to long term, European gas prices will reflect the higher production and distribution costs of LNG compared to pipeline gas.
- Greater sensitivity to global factors: European gas prices will become increasingly influenced not only by fluctuations in global LNG supply but also by changes in Asian gas demand.


