Derivatives of Hydrofluoric Acid
The Prices of Inorganic Fluorides and Fluoropolymers Reflect the High Costs of Hydrofluoric Acid
Published by Luigi Bidoia. .
Inorganic Chemicals Fluorine and derivatives Price Drivers
Hydrofluoric acid is a case where, after the sharp increase in 2022, its price did not experience a subsequent reduction but remained at levels close to those of 2022 and 50% higher than in 2019.
In the article Fluorine Industry: The Criticality of Fluorite, it was highlighted that the primary factor supporting hydrofluoric acid prices is Europe's difficulty in securing fluorite, the main raw material for its production.
In this article, we will analyze the effects of the high price of hydrofluoric acid on the prices of its derivatives.
Most derivatives of hydrofluoric acid can be classified into two main categories:
- Inorganic fluorides: Chemical compounds in which fluorine is bonded to metallic or non-metallic elements, such as aluminum fluoride or sodium fluoride.
- Fluoropolymers: Polymers derived from the polymerization of monomers (such as tetrafluoroethylene), obtained through chemical processes involving hydrofluoric acid.
Inorganic Fluorides
Price Levels
The following table compares, in the first two rows, the prices of hydrofluoric acid in Europe and the United States. The two prices are closely aligned, with a "discount" for the U.S. price ranging between 10% and 20%. Even in the United States, the price in 2024 remained higher than in 2022 and nearly 70% higher than in 2019, confirming that the market dynamics of this product affect not only Europe but also the U.S. market.
Prices of Hydrofluoric Acid and Derivatives ($/ton)
| 2019 | 2020 | 2021 | 2022 | 2023 | 2024 | |
| Hydrofluoric Acid | ||||||
| D-Last Price EU - Hydrofluoric Acid | 1864 | 1878 | 1812 | 2483 | 2792 | 2669 |
| D-Historical USA - Hydrofluoric Acid (USA CIF) | 1584 | 1543 | 1598 | 2002 | 2472 | 2576 |
| >Hydrofluoric Acid Derivatives | ||||||
| D-Last Price EU - Ammonium or Sodium Fluorides | 2070 | 2185 | 2393 | 2712 | 3199 | 3295 |
| D-Last Price EU - Aluminum Fluoride | 1560 | 1277 | 1217 | 1643 | 1763 | 1462 |
| D-Historical China - Aluminum Fluoride (China FOB) | 1478 | 1196 | 1306 | 1517 | 1370 | 1385 |
The third row of the table reports the price of ammonium and sodium fluorides in the European Union. As expected, their price is slightly higher than that of hydrofluoric acid, indicating that fluoride pricing is formed as a markup over the cost of its primary production input. For both ammonium and sodium fluorides, the 2024 price remains higher than in 2022 and, most notably, 64% above 2019 levels.
The pricing dynamics of aluminum fluoride, however, differ significantly in two key aspects:
- Its price is consistently lower than that of hydrofluoric acid, from which it is derived.
- In 2024, its price is lower than in 2022, aligning with the general trend observed in most commodity prices on the European market.
In addition to the price of aluminum fluoride in the EU, the table also includes the price of Chinese exports, as China is the world's leading producer and exporter of this compound. The prices of aluminum fluoride show similar levels and trends in both regions, confirming that the unique pricing characteristics of this product are not exclusive to the European market but are inherent to the product itself. Aluminum fluoride is widely used in aluminum production and is manufactured in vertically integrated plants, where hydrofluoric acid production serves merely as an intermediate stage before the final synthesis of aluminum fluoride.
Do you want to stay up-to-date on commodity market trends?
Sign up for PricePedia newsletter: it's free!
Price Dynamics
The price trends of fluorides closely mirror those of hydrofluoric acid. The price elasticity[1] of fluoride in response to changes in hydrofluoric acid prices ranges between 0.5 and 0.6, depending on the specific type of fluoride: a 10% increase in hydrofluoric acid prices—all else being equal—translates into a 5% to 6% rise in fluoride prices.
Price elasticity concerning other input costs is generally below 0.5. For example:
- For sodium carbonate, which is required for sodium fluoride production, elasticity is 0.13.
- For alumina, used in aluminum fluoride production, elasticity is 0.42.
Fluoropolymers
Price Levels
The most important monomer forming the base component of fluoropolymers is tetrafluoroethylene (TFE), obtained from the interaction of hydrofluoric acid with chloroform (trichloromethane). Among homopolymers (which contain only one type of monomer), polytetrafluoroethylene (PTFE) is the most significant fluoropolymer. Also known by its commercial name Teflon, it accounts for approximately 60% of the total fluoropolymer production. Among copolymers, the most relevant are those that combine PTFE with ethylene and propylene polymers. The table below presents the annual average prices of PTFE and TFE copolymers from 2019 to 2024.
Fluoropolymer Prices ($/ton)
| 2019 | 2020 | 2021 | 2022 | 2023 | 2024 | |
| D-Last Price EU - Polytetrafluoroethylene (PTFE) | 11964 | 11600 | 12693 | 13635 | 16416 | 15094 |
| D-Last Price EU - Tetrafluoroethylene Copolymers | 19059 | 18680 | 19101 | 26537 | 31784 | 28054 |
The price level of fluoropolymers is very high, confirming the specificity of these products. In particular, the price of copolymers is significantly high, reflecting their status as niche products intended for highly specialized applications.
Despite the low incidence of hydrofluoric acid prices on total costs, fluoropolymer price levels also follow the pattern already observed for hydrofluoric acid and many of its derivatives: in 2024, the price was higher than in 2022 and, most notably, between 30% and 50% above pre-crisis levels.
The increase in hydrofluoric acid prices and their current high levels appear to have influenced fluoropolymer prices more than their actual weight in production costs. This phenomenon is particularly evident in tetrafluoroethylene (TFE) copolymers.
Price dynamics
The price trends of fluoropolymers are also closely linked to those of hydrofluoric acid, with elasticity slightly above 0.5. For PTFE, elasticity is 0.56, while for TFE copolymers, it is 0.54.
As expected, PTFE prices are also influenced by the price of chloroform (trichloromethane), with an elasticity of 0.36. Copolymer prices, on the other hand, depend on the costs of other polymers combined with TFE, but with generally low elasticity. For example, the elasticity of copolymers concerning ethylene prices is 0.1.
The niche nature of copolymers is also reflected in a significant correlation with the average European inflation rate, with elasticity close to 1. This means that, all other factors being equal, TFE copolymers tend to follow the inflationary trend of the Eurozone economy.
Conversely, PTFE prices are not affected by inflation but are closely linked to the phases of the global industrial cycle. All other factors being equal, its price tends to rise during periods of industrial expansion and decline during economic downturns. This characteristic makes PTFE behave more like a commodity rather than a highly differentiated product.
Conclusions
The unique price dynamics of hydrofluoric acid, with 2024 levels more than 50% higher than those in 2019 and even exceeding those in 2022—the peak year of the recent commodity price cycle—have also influenced the price trends and levels of its derived chemical products.
All derived chemical products show a price elasticity to variations in hydrofluoric acid prices ranging between 0.5 and 0.6, regardless of the proportion of hydrofluoric acid costs in the total production costs of the derivative.
While this elasticity appears consistent with the cost structure of inorganic fluorides, it seems relatively high compared to the cost structure of fluoropolymers. Specifically, for TFE copolymers, whose price is approximately ten times that of hydrofluoric acid, this elasticity appears to reflect more the market power of producers rather than an actual need to increase prices to cover rising production costs.
The analysis suggests that, during the 2022 crisis, there was an adjustment in the prices of niche products, driven by rising input costs. However, the extent of this increase went beyond merely compensating for higher production costs.
[1] The elasticities reported in this text are the result of structural models specifically estimated for the price of each hydrofluoric acid derivative. The models used follow the dynamic specification of Engel and Granger. The estimated parameters, from which the reported elasticities are derived, are statistically significant with a 99% probability level.
You may be interested in:

The Ammonia Industry and Its Derivatives
Published by Luigi Bidoia. .
Inorganic Chemicals Cost pass-throughUn'analisi econometrica del cost pass through lungo la filiera dell'ammoniaca [ Read all ]
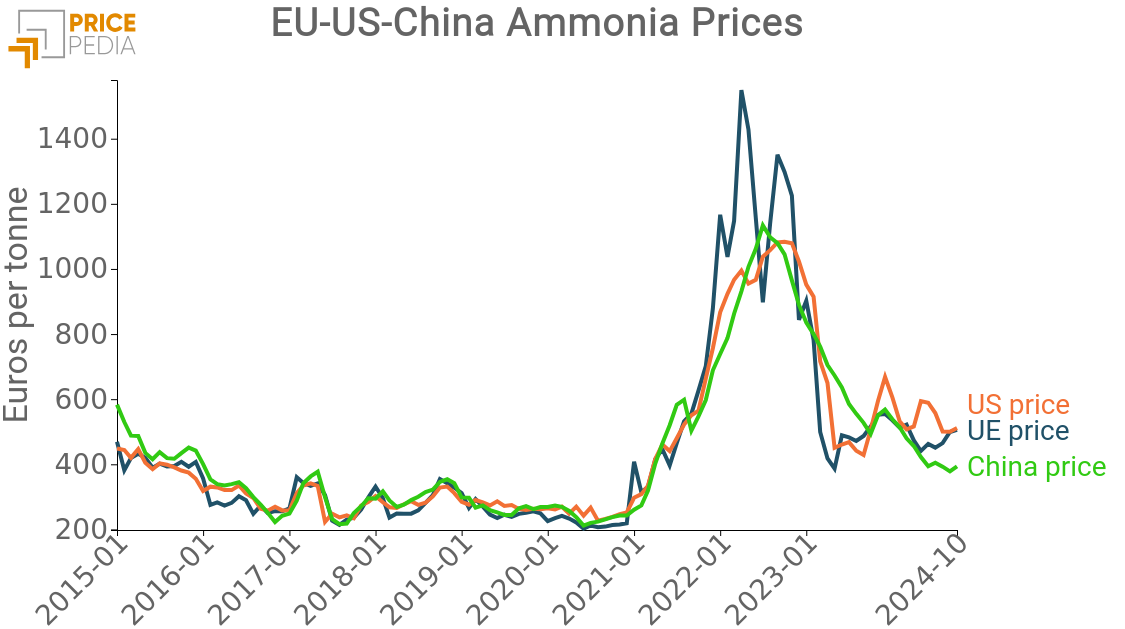
Ammonia in the global market: trade and price dynamics
Published by Emanuele Altobel. .
Inorganic Chemicals Price DriversAn analysis of major exporting, importing countries and the forces influencing prices, from natural gas to political and competitive dynamics. [ Read all ]
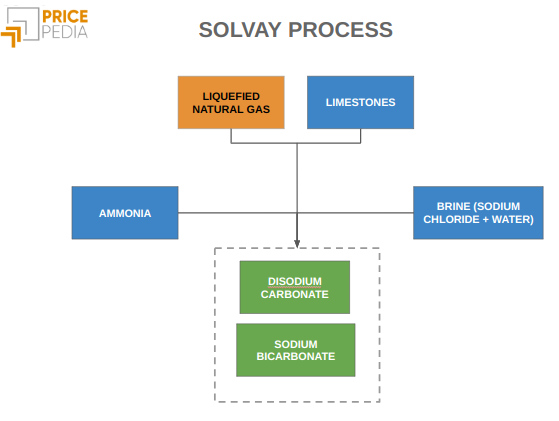
Sodium carbonate and sodium bicarbonate: production processes and price determinants
Published by Emanuele Altobel. .
Inorganic Chemicals Price DriversCost models provide a complete explanation of their price dynamics, even in more recent years [ Read all ]