Peace outlook and trade policies drive commodity markets
Possible peace in Ukraine and Middle East calms energy prices while metals anticipate upcoming tariffs
Published by Luca Sazzini. .
Conjunctural Indicators Commodities Financial WeekIn last week's article: "Trump's tariffs: more wrestling than boxing?" it was highlighted how Donald Trump's trade strategy, based on constant tariff threats, represents more of a negotiation pressure tactic than a definitive measure.
As of today, the only measures actually implemented are the 10% tariffs on China, while tariffs on Mexico and Canada have been postponed to March 4.
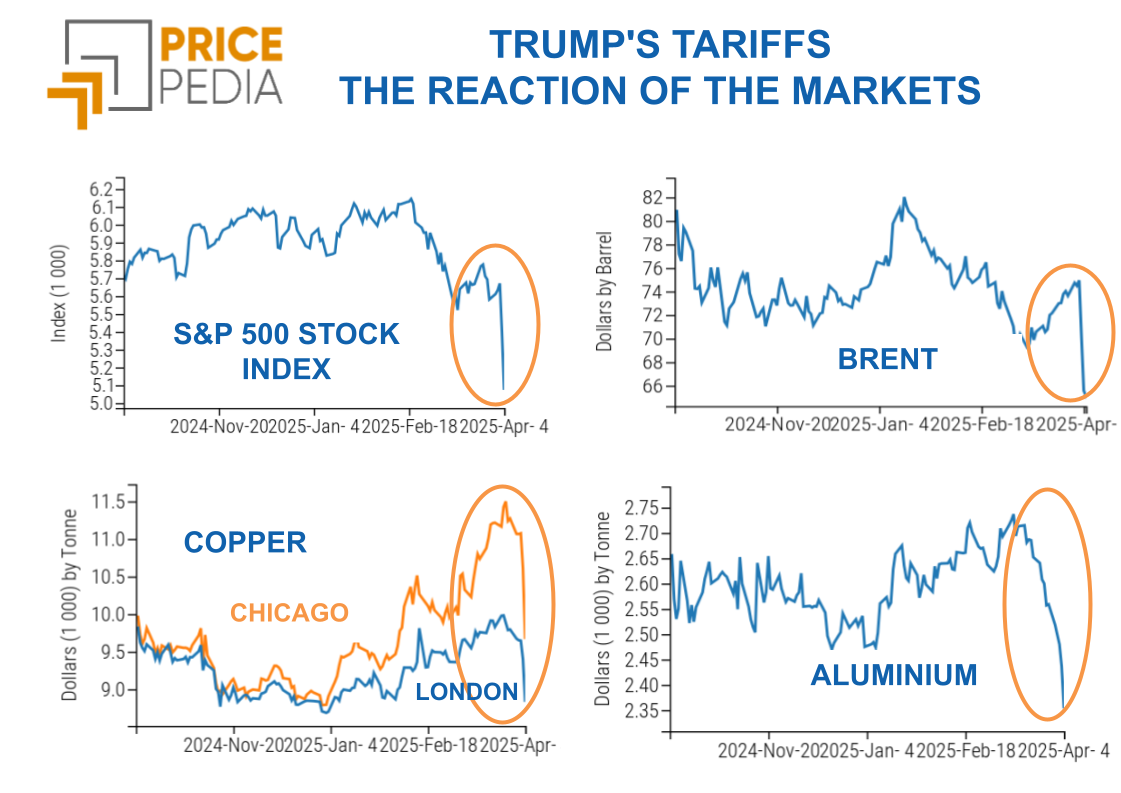
This week, the U.S. trade pressure strategy continued with the announcement of a 25% tariff on all imports of steel and aluminum. These tariff measures are expected to take effect on March 12, 2025, and will apply to all exporting countries to the United States, without any exceptions.
During his previous term, Trump had already threatened tariffs on Canadian and Mexican steel and aluminum, but temporary exemptions were later granted, or bilateral agreements were reached through the USMCA.
If these tariffs come into effect, analysts predict a price increase in the U.S. market, despite possible compensatory measures that the Trump administration might introduce. On an international level, however, a reduction in the prices of the sanctioned commodities is expected, as the tariffs will reduce exports to the U.S., thus increasing supply in global markets.[1]
A market that has anticipated this possible scenario is that of copper in the United States. On Thursday, quotations at the Chicago Mercantile Exchange (CME) recorded a premium of over $1,100 per ton compared to London Metal Exchange (LME) prices. The following day, the strong attraction exerted by the higher CME prices triggered a sudden readjustment of spot quotations at the LME, with an increase of almost 4% compared to Thursday's levels. For the first time in the past 19 months, copper prices returned to backwardation, with the value of three-month contracts nearly $150 lower than spot prices.
[1] For a detailed analysis of the effects of Trump's tariffs on steel and aluminum, refer to the following studies: "Effects of US tariffs on global commodity prices" and "Protectionist policies: the case of steel tariffs".
Weekly Summary of Financial Commodity Prices
The continued threats of new tariffs from President Trump are supporting the rise in gold prices, which reached new highs this week. The main driver of this increase is the growing demand in China, spurred by the launch of a pilot program allowing a select group of insurance companies to invest up to 1% of their assets in gold bars, aiming to further diversify their portfolios.
The prices of industrial metals have not been significantly affected by Trump's new tariff threats on steel and aluminum. Although prices of iron ore and aluminum initially rose following the tariff announcement, this increase was only temporary, followed by a downward correction.
Except for what is happening with copper prices at the CME and, consequently, at the LME, overall, there have been no significant changes in ferrous and non-ferrous metal prices.
In the energy sector, prices have shown strong fluctuations in both the oil and natural gas markets.
After an increase at the beginning of the week, oil and European natural gas prices reversed their trend following news of peace negotiations between Ukraine and Russia, initiated by President Trump.
The price of U.S. natural gas Henry Hub deviated from this general trend, continuing to rise due to concerns over a larger-than-expected decline in U.S. gas inventories.
The tropical food market recorded a significant price increase, mainly driven by the surge in Arabica coffee prices. This rise was caused by shrinking global stocks and exports, further exacerbated by growing concerns over adverse weather conditions that could further impact production.
U.S. Inflation
In January, U.S. inflation rose beyond analysts' and financial markets' expectations.
The Consumer Price Index (CPI) increased by 0.5% on a monthly basis and 3% on a yearly basis, compared to expectations of 0.3% m/m and 2.9% y/y.
The core component of the index grew by 0.4% m/m and 3.3% y/y, exceeding both December's values (0.2% m/m and 3.2% y/y) and analysts' expectations (0.3% m/m and 3.1% y/y).
These figures, combined with fears of a potential inflation rise due to the Trump administration’s tariffs, have led traders to postpone expectations for a FED rate cut from September to December 2025.
Federal Reserve Chairman Jerome Powell reiterated that inflation in the United States remains too high and that there is no rush to end the current restrictive monetary policy adopted by the central bank.
Meanwhile, Trump continues to pressure the central bank to lower interest rates, arguing that such a measure should accompany the upcoming tariffs introduced by his administration.
ENERGY
The PricePedia index of energy product prices shows an increase in prices in the first days of the week, followed by a downward correction.
PricePedia Financial Index of Energy Prices in dollars

The PricePedia energy heatmap highlights in red the increase in U.S. Henry Hub natural gas prices and in green the decrease in European TTF (Netherlands) natural gas and thermal coal prices.
Energy Price HeatMap in euros

PLASTIC MATERIALS
The financial index of plastic materials and Chinese elastomers shows a price increase in the first days of the week, followed by sideways movements.
PricePedia Financial Indices of Plastic Prices in dollars

The heatmap for plastics and elastomers signals an increase in the prices of Linear Low-Density Polyethylene (LLDPE) and RRS3 natural rubber.
HeatMap of plastic and elastomer prices in euros

FERROUS
The financial index of ferrous metals in the European market shows relative price stability, while the Chinese market index shows a slight decline.
PricePedia Financial Indices of ferrous metal prices in dollars

The heatmap analysis highlights the rise in hot-rolled coil prices in the American market, while prices for steel rebar and wire rod have decreased in the Chinese market.
HeatMap of ferrous prices in euros

Do you want to stay up-to-date on commodity market trends?
Sign up for PricePedia newsletter: it's free!
NON-FERROUS INDUSTRIAL
Despite some opposite fluctuations, the two financial indices of non-ferrous metals listed on the London Metal Exchange (LME) and the Shanghai Futures Exchange (SHFE) have mostly followed an upward price trend.
PricePedia Financial Indices of non-ferrous industrial metal prices in dollars

The non-ferrous heatmap shows a slight weekly increase in prices for tin and, as already seen, for copper at the LME.
Conversely, nickel prices have shown the most significant decline. This drop was influenced by the release of the Philippine Nickel Industry Association report, which suggests that the country's nickel ore production will increase by 10-15% in 2025.
It is also noteworthy that, despite the announcement of new tariffs by the Trump administration, the weekly price variation for aluminum remained very limited.
HeatMap of non-ferrous prices in euros

FOOD PRODUCTS
The financial indices for tropical products and oils report an increase in prices, while the cereal index shows a slight fluctuation that does not affect its level.
PricePedia Financial Indices of food prices in dollars

CEREALS
The cereal heatmap highlights a drop in prices for soybeans (seeds and meal) and oats.
HeatMap of cereal prices in euros

TROPICALS
From the tropical product heatmap, there is a sharp increase in arabica coffee prices and, to a lesser extent, in raw sugar prices.
HeatMap of tropical food prices in euros

OILS
The oil heatmap shows a slight weekly increase in prices, with a more pronounced rise for palm oil.
HeatMap of food oil prices in euros

You may be interested in:

Transfer of US-China tensions from trade to financial flows
Published by Luca Sazzini. .
Conjunctural Indicators Commodities Financial WeekMarkets under stress: how Trump's tariffs affect financial price fluctuations [ Read all ]
Liberation or Ruination Day? A storm of tariffs on commodity markets
Published by Luca Sazzini. .
Conjunctural Indicators Commodities Financial WeekFinancial markets fail U.S. protectionist policy [ Read all ]

Commodities in check since Trump's annnucials
Published by Luca Sazzini. .
Conjunctural Indicators Commodities Financial WeekFaced with uncertainty, investors find refuge in gold [ Read all ]