Turbulent week in financial commodity markets
Strong swings in opposite directions have characterized the prices of oil, European gas, American gas, and nonferrous metals
Published by Luca Sazzini. .
Conjunctural Indicators Commodities Financial WeekWeekly Summary of Financial Commodity Prices
This week, financial commodity markets were characterized by high volatility, driven by concerns over supply cuts and the approval of the European Union's sixteenth sanctions package against Russia.
At the beginning of the week, in the energy market, oil prices increased following a Ukrainian drone attack on Russia's Caspian Pipeline Consortium (CPC) pumping station, which reduced crude oil flows from Kazakhstan to global markets. This supply contraction was compounded by uncertainties regarding a possible further delay in OPEC’s production increase.
Finally, on Friday, oil prices lost all gains made during the week, with Brent falling below $75 per barrel, following reports of a possible restoration of the pipeline transporting gas extracted in Kurdistan to Turkey.
The price of Henry Hub US natural gas also experienced strong growth, especially in the first days of the week. This price increase is mainly linked to concerns over inventory declines reported by the Energy Information Administration (EIA), which recently raised its forecasts for US natural gas prices in 2025 and 2026.
On the other hand, prices for European TTF natural gas in the Netherlands, after peaking at 58 euros/MWh on February 10, continue to decline, supported by expectations of a possible peace agreement between Russia and Ukraine.
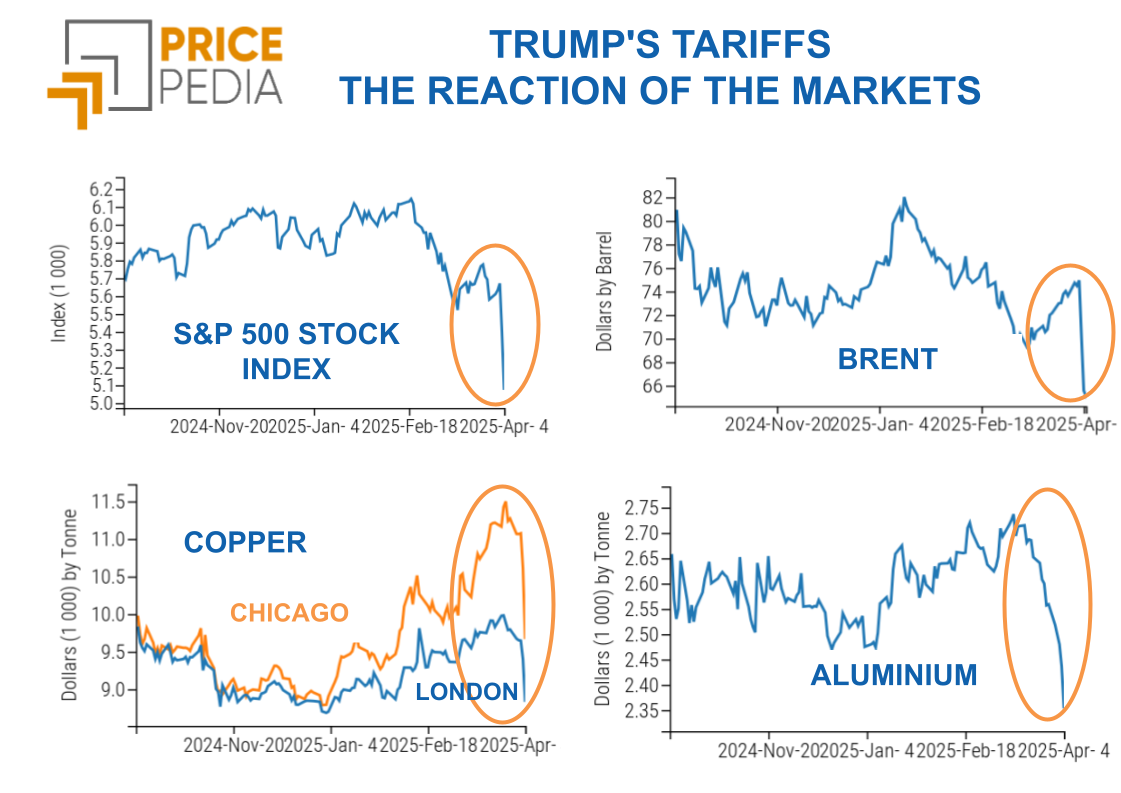
Another market that experienced high volatility this week was non-ferrous industrial metals. In particular, copper prices were subject to strong speculation by traders, who have recently significantly widened the spread between financial prices on the Chicago Mercantile Exchange (CME) and those on the London Metal Exchange (LME) and the Shanghai Futures Exchange (SHFE).
Traders are betting on a greater copper price increase at CME in anticipation of new US import tariffs announced by the Trump administration.
On Monday, copper financial prices at LME realigned with Chinese SHFE market prices, undergoing a sharp correction before recovering in the following days.
Below is a comparison chart of copper price indices quoted in Chicago (CME), London (LME), and Shanghai (SHFE).
Copper Price Index in Financial Markets

The analysis of the chart highlights the realignment between LME and SHFE prices, which both remain significantly lower than those in the US market.
Other particularly relevant price dynamics in the non-ferrous metals market included aluminum and aluminum alloys, which have seen an acceleration in price increases in recent days. This latest rise was driven by the approval of the EU's sixteenth sanctions package, which banned European imports of Russian primary aluminum.
Furthermore, tin prices continue to rise, with intraday quotations on the London Metal Exchange surpassing $33,000 per ton.
In the ferrous metals market, European prices remain relatively stable, while those in the Chinese market are experiencing a more pronounced increase.
In the food sector, a decline in tropical product prices was recorded, driven by profit-taking on Arabica coffee following a stock rebound on Thursday, February 20.
PMI
This week, new flash estimates of the Purchasing Managers' Index (PMI) for the Eurozone and the United States were released.
In both regions, manufacturing recorded a higher-than-expected increase, but service PMIs unexpectedly declined.
Eurozone
The flash estimate of the composite PMI for the Eurozone remained unchanged at 50.2, against analysts' forecasts of an increase to 50.5.
The manufacturing PMI for February is estimated at 47.3, up from 46.6 in January and above the forecast of 46.9.
The flash services PMI remained stable at 50.7.
Overall, the European PMI data suggest very modest economic growth for the Eurozone.
Although the manufacturing PMI exceeded forecasts, it still indicates a continued contraction in the sector, as a value below 50 signals a decline in manufacturing activity.
United States
In February, the flash estimate of the composite PMI for the United States recorded a decline from 52.7 to 50.4.
The slowdown in economic growth observed in the composite PMI was primarily due to the services sector, which disappointed analysts' expectations. The flash estimate of the services PMI came in at 49.7, below the January figure (52.9) and the forecast of 53.
On the other hand, the flash manufacturing PMI surprised on the upside, exceeding analysts' expectations (51.3), rising from 51.2 to 51.6.
These data indicate a slowdown in US economic growth in February, particularly in the services sector, which shows a slight contraction.
ENERGY
The PricePedia energy price index continues to fluctuate due to swings in oil prices and the contrast between rising Henry Hub US natural gas prices and falling Dutch TTF European gas prices.
PricePedia Financial Index of Energy Prices in Dollars

The analysis of the energy heatmap highlights the strong weekly increase in the 3-day moving average of US natural gas prices and the decline in Dutch TTF European gas prices.
HeatMap of Energy Prices in Euro

PLASTIC MATERIALS
The financial index of plastic materials and Chinese elastomers closed the week with a significant increase compared to the levels at the beginning of the week.
PricePedia Financial Indices of Plastic Prices in Dollars

FERROUS METALS
While the European ferrous metal price index remains relatively stable, the Chinese index follows an upward trend in prices.
PricePedia Financial Indices of Ferrous Metal Prices in Dollars

The heatmap analysis highlights an increase in the prices of steel rebar, hot-rolled coils, and iron ore, quoted on the Chinese market, possible signs of a recovery in the Chinese market.
HeatMap of Ferrous Metal Prices in Euro

Do you want to stay up-to-date on commodity market trends?
Sign up for PricePedia newsletter: it's free!
INDUSTRIAL NON-FERROUS METALS
After a drop in the LME index, caused by the decline in copper prices, which returned close to SHFE price levels, the LME non-ferrous metal index recorded an increase, driven by the rebound in copper prices and the rise in aluminum, aluminum alloys, and tin prices.
Meanwhile, the Chinese SHFE market index showed relative stability in the first days of the week, followed by a price increase, though less pronounced than that of the LME index.
PricePedia Financial Indices of Industrial Non-Ferrous Metal Prices in Dollars

The non-ferrous heatmap indicates a weekly increase in aluminum, tin, and, most notably, aluminum alloy prices.
HeatMap of Non-Ferrous Metal Prices in Euro

FOOD COMMODITIES
The tropical food index experienced a price drop on Thursday due to profit-taking in the Arabica coffee market, following an increase in stock levels.
The edible oil index recorded an increase over the weekend, while the grain index showed slight fluctuations that did not significantly impact price levels.
PricePedia Financial Indices of Food Prices in Dollars

CEREALS
The cereals heatmap highlights an increase in oat prices.
HeatMap of Cereal Prices in Euro

TROPICAL PRODUCTS
The tropical heatmap indicates a weekly decline, particularly in the moving average of Arabica coffee and cocoa prices, alongside an increase in sugar prices.
HeatMap of Tropical Food Prices in Euro

OILS
The analysis of the edible oil heatmap reveals a slight but widespread increase in oil prices.
HeatMap of Edible Oil Prices in Euro

You may be interested in:
Liberation or Ruination Day? A storm of tariffs on commodity markets
Published by Luca Sazzini. .
Conjunctural Indicators Commodities Financial WeekFinancial markets fail U.S. protectionist policy [ Read all ]

Commodities in check since Trump's annnucials
Published by Luca Sazzini. .
Conjunctural Indicators Commodities Financial WeekFaced with uncertainty, investors find refuge in gold [ Read all ]
Shock in energy markets over tensions between U.S. and Iran
Published by Luca Sazzini. .
Conjunctural Indicators Commodities Financial WeekGrowth in energy prices is associated with growth in nonferrous metals [ Read all ]