Trump under exam: markets send signals of distrust
Increased volatility and uncertainty causes U.S. stock markets and the U.S. dollar to plummet
Published by Luca Sazzini. .
Conjunctural Indicators Commodities Financial WeekPresident Donald Trump has once again shaken financial markets by imposing tariffs on imports, only to suspend them just two days later.
On Tuesday, March 4, U.S. tariffs on imports from Canada and Mexico officially came into effect, with a 25% rate, except for energy resources imported from Canada, which were subject to a reduced tariff of 10%. At the same time, the Trump administration announced additional protectionist measures, including new tariffs on imported U.S. agricultural products. Additionally, a new executive order doubled tariffs on Chinese imports from 10% to 20%. According to the White House, this decision was motivated by Beijing’s failure to curb fentanyl exports.
In response to these tariffs, Canada, Mexico, and China have taken countermeasures.
Canada and Mexico announced the introduction of new 25% tariffs on U.S. imports, effective April 2, while China introduced an additional tariff ranging from 10% to 15% depending on the imported goods (mainly food products), set to take effect on March 10.
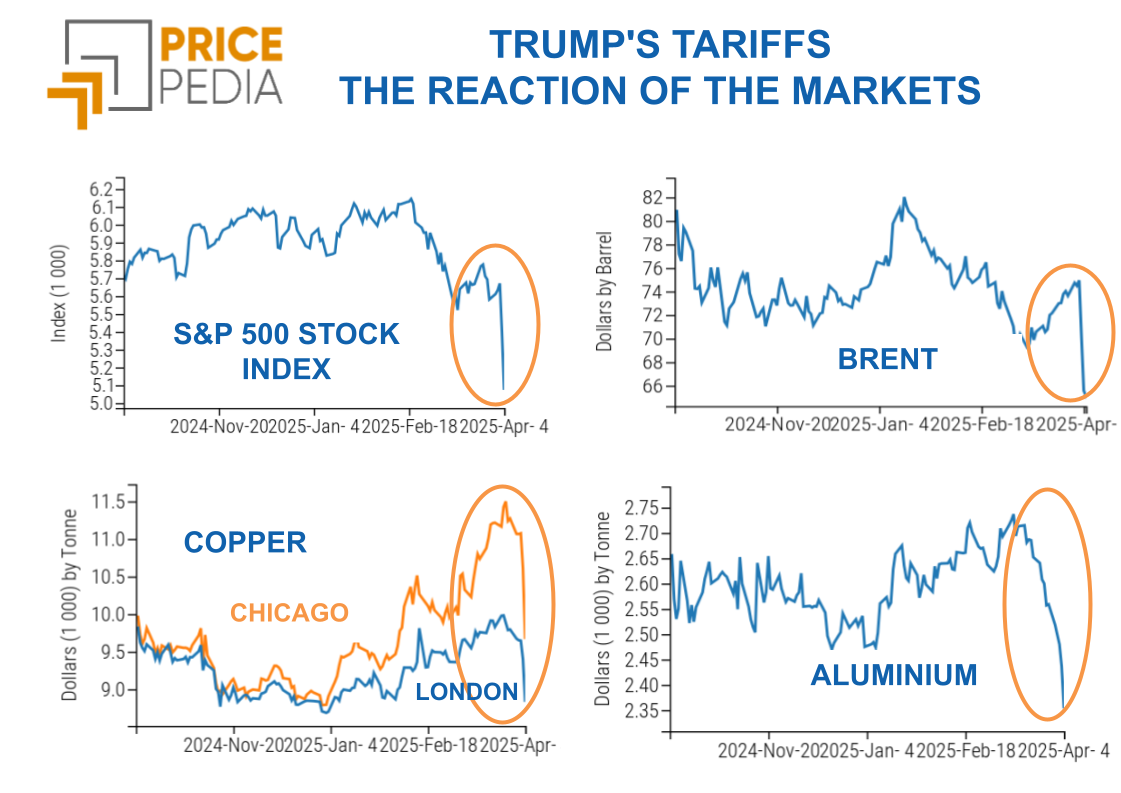
Following this trade escalation, President Trump further changed his approach, deciding to postpone the implementation of trade tariffs on Canada and Mexico to April 2, 2025. These trade strategies adopted by the new U.S. president do not seem to be welcomed by U.S. stock markets, which have recorded a significant contraction this week. Trump's continuous announcements are increasing investor fears, generating high volatility in both stock markets and commodity markets.
The following chart shows a volatility index calculated as the average between the VIX, the fear index of the U.S. stock market, and the PricePedia volatility index, which represents the dispersion of commodity prices.[1]
Volatility index of the U.S. stock market and commodity prices

The analysis of the chart highlights the increase in volatility this week, triggered by President Trump’s announcements and negative macroeconomic data from the U.S. economy. In particular, the rise in the trade deficit has exacerbated the downward revision of the U.S. GDP estimate for the first quarter of 2025 by the Federal Reserve Bank of Atlanta. On March 3, the bank forecasted a GDP contraction of -2.8%, a particularly negative figure considering that just four weeks ago, a 3.9% growth was expected.
In addition to increasing uncertainty in financial markets, the early-week trade escalation and negative macroeconomic data from the U.S. economy have contributed to a sharp depreciation of the U.S. dollar.
The following chart illustrates the exchange rate trend between the euro and the U.S. dollar.
Exchange rate between the euro and the U.S. dollar

The chart analysis highlights the strengthening of the euro against the U.S. dollar this week. This appreciation, initially triggered by trade tariffs, was further amplified by new growth prospects for Germany. Germany has proposed a modification to the constitutional "debt brake" (Schuldenbremse) to finance defense and infrastructure projects through the creation of an infrastructure fund exceeding 500 billion dollars.
Weekly summary of financial commodity prices
This week saw an overall decrease in commodity prices,
mitigated by the depreciation of the U.S. dollar.
In energy markets, the decline in oil and natural gas prices was particularly sharp due to new expectations of future supply increases.
At the beginning of the week, during a virtual meeting, OPEC decided to gradually increase oil production, contrary to market expectations, leading to a sharp price drop.
Another price that experienced a steep decline this week was that of Dutch TTF natural gas. The price drop was caused by the postponement of the European plan to phase out energy imports from Russia. This news has fueled hopes of a potential partial reopening of the Russian gas pipeline, should the peace agreement between Russia and Ukraine have a positive outcome.
However, the risk of reduced stockpiles in the European market remains high. To strengthen supply security, the European Union has proposed extending the current gas storage regulation until the end of 2027, requiring member states to fill storage levels up to 90% by November 1 of each year.
Except for hot-rolled coils, the ferrous metals market saw a general decline in prices, particularly sharp for Chinese iron ore. The Chinese National Development and Reform Commission announced plans to cut steel production to tackle overproduction, improve sector profitability, and reduce pollution. This led to a decline in domestic demand for iron ore, further driving down prices amid ongoing U.S.-China trade tensions.
Meanwhile, non-ferrous metal prices increased following the announcement by German Chancellor Friedrich Merz regarding plans to boost German public spending on defense and national security. This pushed European defense and industry stocks higher, driving up demand for non-ferrous metals.
Additionally, a growing divergence has been observed between financial copper prices, with those listed on the Chicago Mercantile Exchange (CME) rising significantly more than those on the London Metal Exchange (LME) and the Shanghai Futures Exchange (SHFE). These divergences are also linked to Trump’s trade announcements, in which he declared his intention to impose 25% tariffs on U.S. copper imports.
ECB monetary policy
As anticipated in last week's article: Uncertainty skyrockets after clash in Oval Office, the European Central Bank (ECB) has cut interest rates by 25 basis points, in line with analyst expectations.
Currently, inflation trends are consistent with analyst expectations, who foresee a realignment to the 2% target. However, ongoing trade tensions and increased defense spending could lead to a potential inflationary surge. Given these risks, predicting the outcomes of future monetary policy meetings will become more complex, as ECB President Lagarde stated that decisions will depend solely on upcoming macroeconomic data.
NUMERICAL APPENDIX
ENERGY
The PricePedia index of energy product prices records a sharp decline in prices.
PricePedia Financial Index of Energy Prices in Dollars

The PricePedia energy heatmap highlights the general decline in energy prices, especially for oil and Dutch TTF natural gas prices. However, there is an increase in the three-day moving average of U.S. domestic gasoline and Henry Hub natural gas prices, although both have shown a slight decrease in recent days.
HeatMap of Energy Prices in Euros

PLASTICS
The financial index of Chinese plastics and elastomers indicates a price reduction.
PricePedia Financial Indices of Plastic Prices in Dollars

All prices in the plastics and elastomers heatmap show a decline.
HeatMap of Plastic and Elastomer Prices in Euros

FERROUS METALS
The financial index of ferrous metals in the Chinese market experiences a price contraction, while the European index follows an upward trend, solely due to the rise in hot-rolled coil prices.
PricePedia Financial Indices of Ferrous Metal Prices in Dollars

The heatmap analysis highlights a general decline in ferrous metal prices, except for hot-rolled coil prices.
HeatMap of Ferrous Metal Prices in Euros

The sharp increase in coil prices on the CME market is mainly due to the contract rollover of the one-month continuous index.[2]
Below is a comparison between the continuous index of CME coil prices, the February contract price, and the March price, which includes the presence of steel trade tariffs coming into effect on March 12.
Comparison of Financial Contract Prices of Hot-Rolled Coils on the CME Market

Do you want to stay up-to-date on commodity market trends?
Sign up for PricePedia newsletter: it's free!
INDUSTRIAL NON-FERROUS METALS
The financial indices of non-ferrous metal prices indicate a price increase in both the LME and SHFE markets.
PricePedia Financial Indices of Industrial Non-Ferrous Metal Prices in Dollars

The weekly moving average of cobalt and aluminum alloy prices continues to rise this week, while tin prices decline.
HeatMap of Non-Ferrous Metal Prices in Euros

FOOD
Despite some contrasting fluctuations, the overall trend of food price indices is downward.
PricePedia Financial Indices of Food Prices in Dollars

CEREALS
The cereals heatmap shows a generalized decline in the three-day moving average prices, particularly for wheat, corn, and rough rice.
HeatMap of Cereal Prices in Euros

TROPICALS
The tropicals heatmap reveals a sharp drop in the financial prices of cocoa and sugar.
HeatMap of Tropical Food Prices in Euros

OILS
The edible oil heatmap is shaded green, indicating a general price decline.
HeatMap of Food Oil Prices in Euro

[1] For the calculation of this overall index, both volatility indices have been normalized, setting January 2022 as the base equal to 100.
[2] For more details on the construction of the continuous index, see the article: Hot-rolled Coils USA: Future Continous.
You may be interested in:
Liberation or Ruination Day? A storm of tariffs on commodity markets
Published by Luca Sazzini. .
Conjunctural Indicators Commodities Financial WeekFinancial markets fail U.S. protectionist policy [ Read all ]

Commodities in check since Trump's annnucials
Published by Luca Sazzini. .
Conjunctural Indicators Commodities Financial WeekFaced with uncertainty, investors find refuge in gold [ Read all ]
Shock in energy markets over tensions between U.S. and Iran
Published by Luca Sazzini. .
Conjunctural Indicators Commodities Financial WeekGrowth in energy prices is associated with growth in nonferrous metals [ Read all ]