Amid duties and uncertainties, gold takes center stage
Uncertainty immobilizes commodity prices, with only two exceptions: gold and cobalt
Published by Luca Sazzini. .
Conjunctural Indicators Commodities Financial WeekPresident Donald Trump continues with an aggressive trade strategy, using tariffs as a pressure lever. On March 11, he announced a doubling of tariffs on Canadian steel and aluminum to 50%, in response to Ontario’s 25% surcharge on electricity exports to the U.S. After negotiations, Ontario suspended the surcharge, and Trump revoked the tariff increase.
The trade war has also escalated with the European Union’s response to U.S. tariffs that came into effect on March 12. The EU announced retaliatory measures worth 26 billion euros, equivalent to the 28 billion dollars of U.S. tariffs. Starting April 1, tariffs previously introduced in 2018 and 2020 will be reinstated for 8 billion euros, targeting symbolic goods such as motorcycles, jeans, and bourbon whiskey. An additional 18 billion in tariffs will be imposed from mid-April on industrial and agricultural products. In response, Trump threatened 200% tariffs on European wines, champagne, and spirits unless the EU immediately removes the 50% tariff on U.S. whiskey.
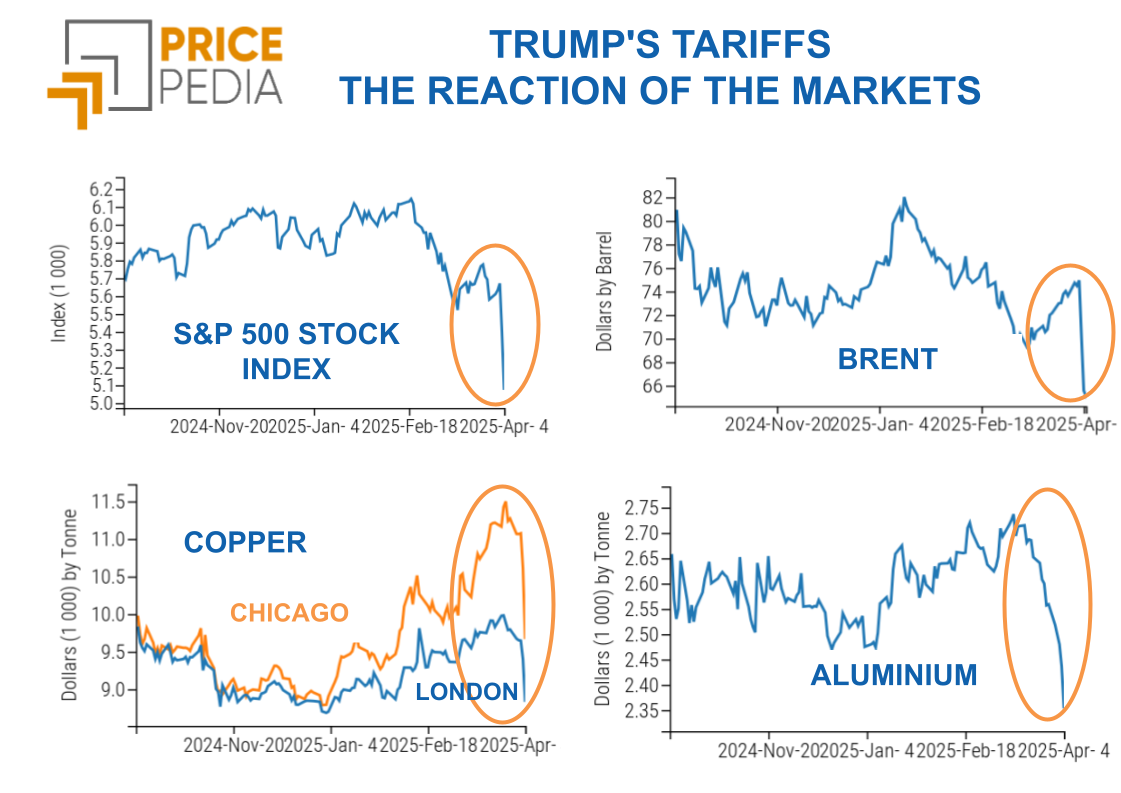
These tensions have heightened fears of a global crisis stemming from a tariff trade war, causing a decline in stock markets and a surge in gold prices, which reached new all-time highs with intraday quotations exceeding $3,000 per troy ounce.
Weekly Summary of Financial Commodity Prices
Financial commodity markets experienced varied price movements this week.
The price of oil followed an uncertain trend with mixed fluctuations, driven by concerns over the trade war. In this regard, Barclays, one of the leading multinational banks, lowered its 2025 Brent price forecast by $9 per barrel due to high economic uncertainty that could hinder future demand growth.
The price of natural gas also showed mixed fluctuations throughout the week, although its price trend was more defined than that of oil. In Europe, despite fluctuations, prices closed the week higher, while in the United States, a decline was observed. The high volatility of European gas remains closely tied to uncertainties over Russian supply. Even if a peace agreement between Russia and Ukraine is reached, restoring supplies could take months, not to mention that the European Union may not be willing to resume purchasing gas from Russia.
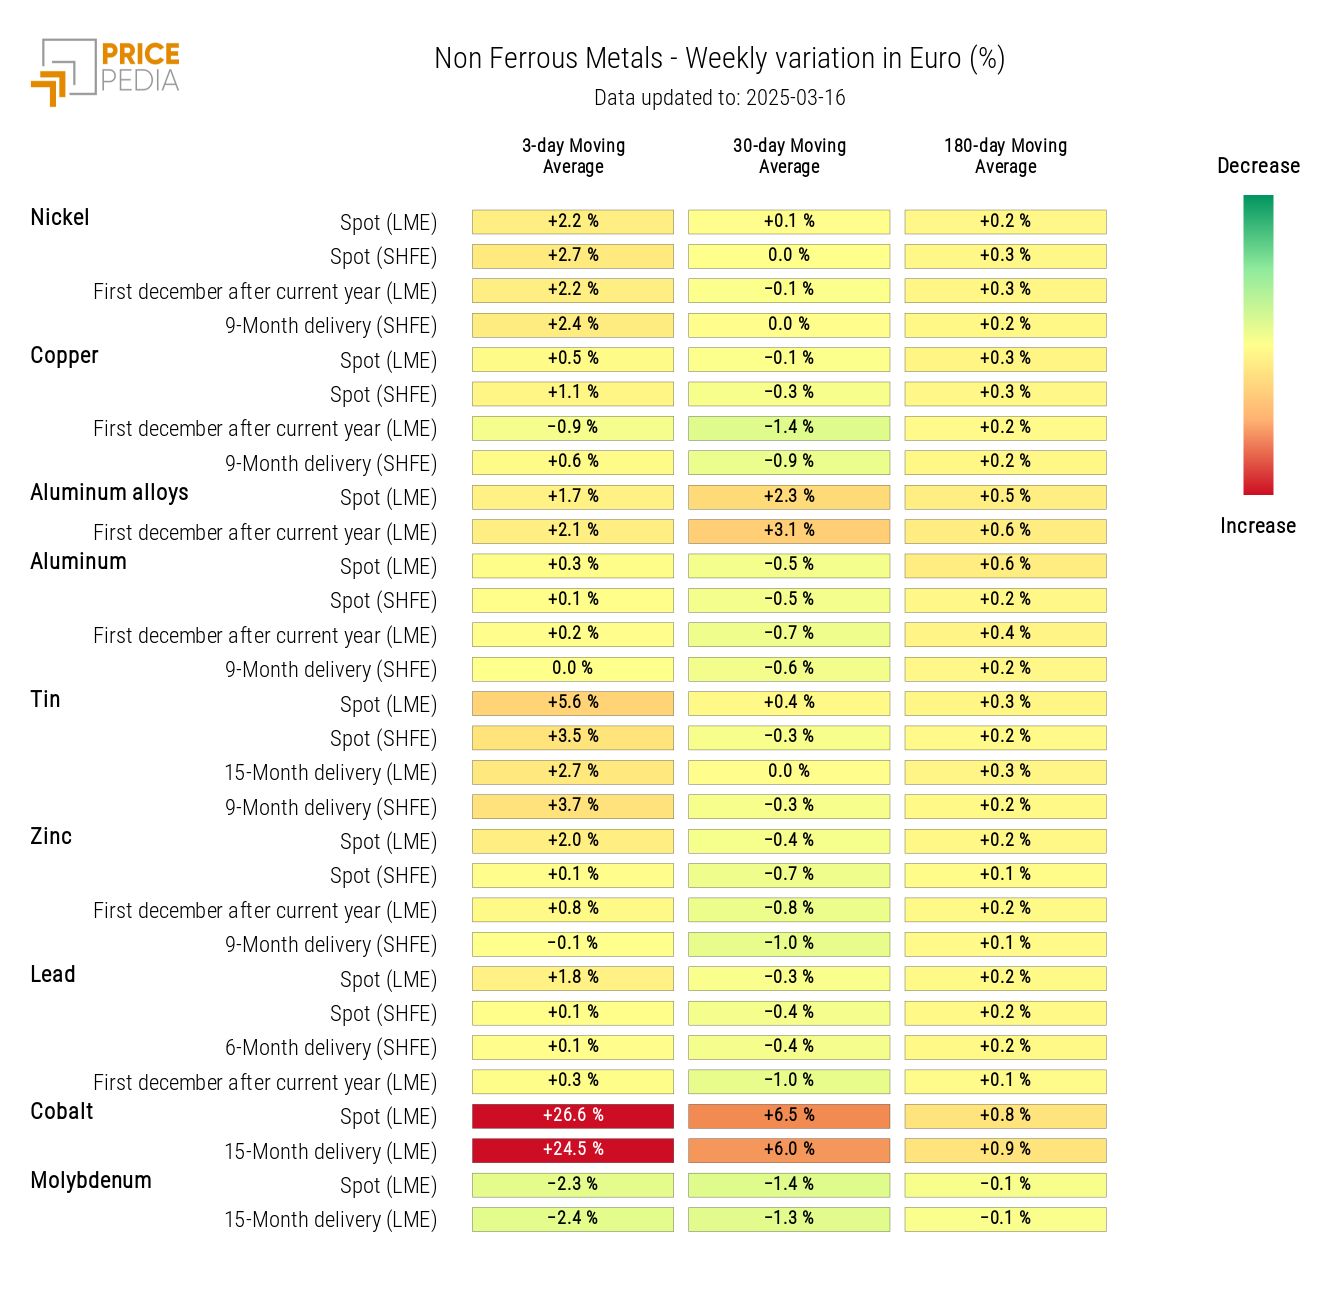
In the ferrous metals market, prices remained more stable, while volatility continued in the non-ferrous metals market, which, despite fluctuations, showed an overall price increase.
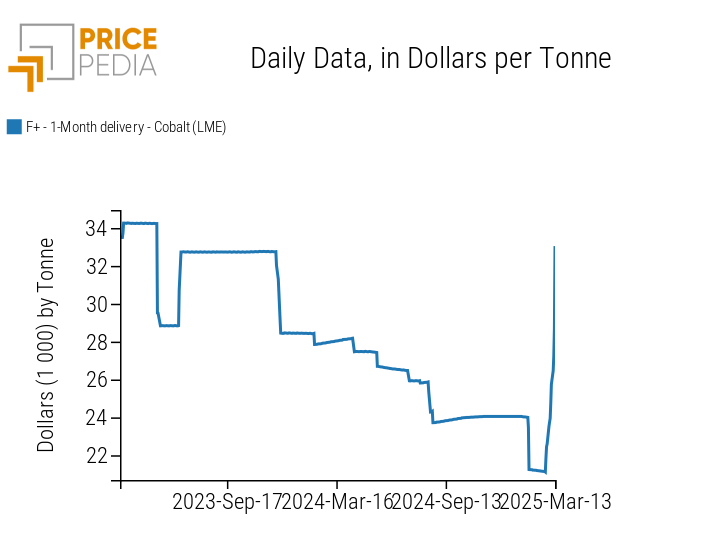
In particular, cobalt was the metal that recorded the most significant variations, leading to a suspension of trading on the Wuxi Stainless Steel Exchange due to excessive price increases.
This surge began at the end of February after the Democratic Republic of the Congo, the world’s largest producer, announced a temporary four-month export suspension to reduce excess supply that had weakened prices.
Meanwhile, the London Metal Exchange (LME) temporarily suspended the Lending Guidance for cobalt, a rule requiring traders with large stocks in LME warehouses to lend the metal to maintain market liquidity. This measure was taken to prevent the already low stocks from being further reduced by the lending requirement, exacerbating the market shortage.
LME Cobalt Prices in $/ton
U.S. Inflation
In February, there was an unexpected slowdown in U.S. inflation growth.
The Consumer Price Index (CPI) rose by 0.2% m/m, below the expected 0.3% and significantly lower than January’s +0.5%.
On an annual basis, inflation growth fell from 3% to 2.8% y/y, below the forecasted 2.9%.
The core index, which excludes energy and food, also showed signs of slowing. Monthly growth stood at 0.2% m/m, below the expected 0.3% and January’s 0.4%. On an annual basis, the core index increased by 3.1% y/y, down 0.1 percentage points from expectations (3.2%) and 0.2 points from January (3.3%).
The slowdown in U.S. inflation is a positive signal for the Federal Reserve, but it is unlikely to be enough to allow for an interest rate cut in next week’s meeting. Despite the recent slowdown in economic growth, the U.S. economy remains resilient, making it more likely that the FED will keep interest rates unchanged to prevent the risk of inflation rebounding due to new U.S. tariffs.
NUMERIC APPENDIX
ENERGY
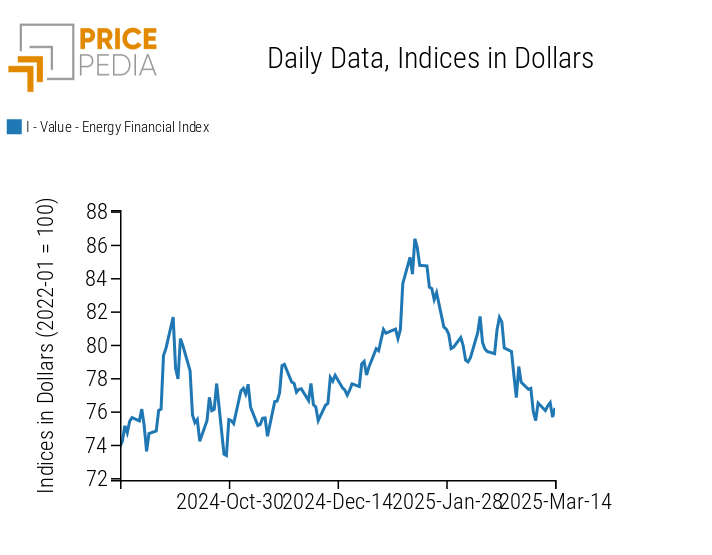
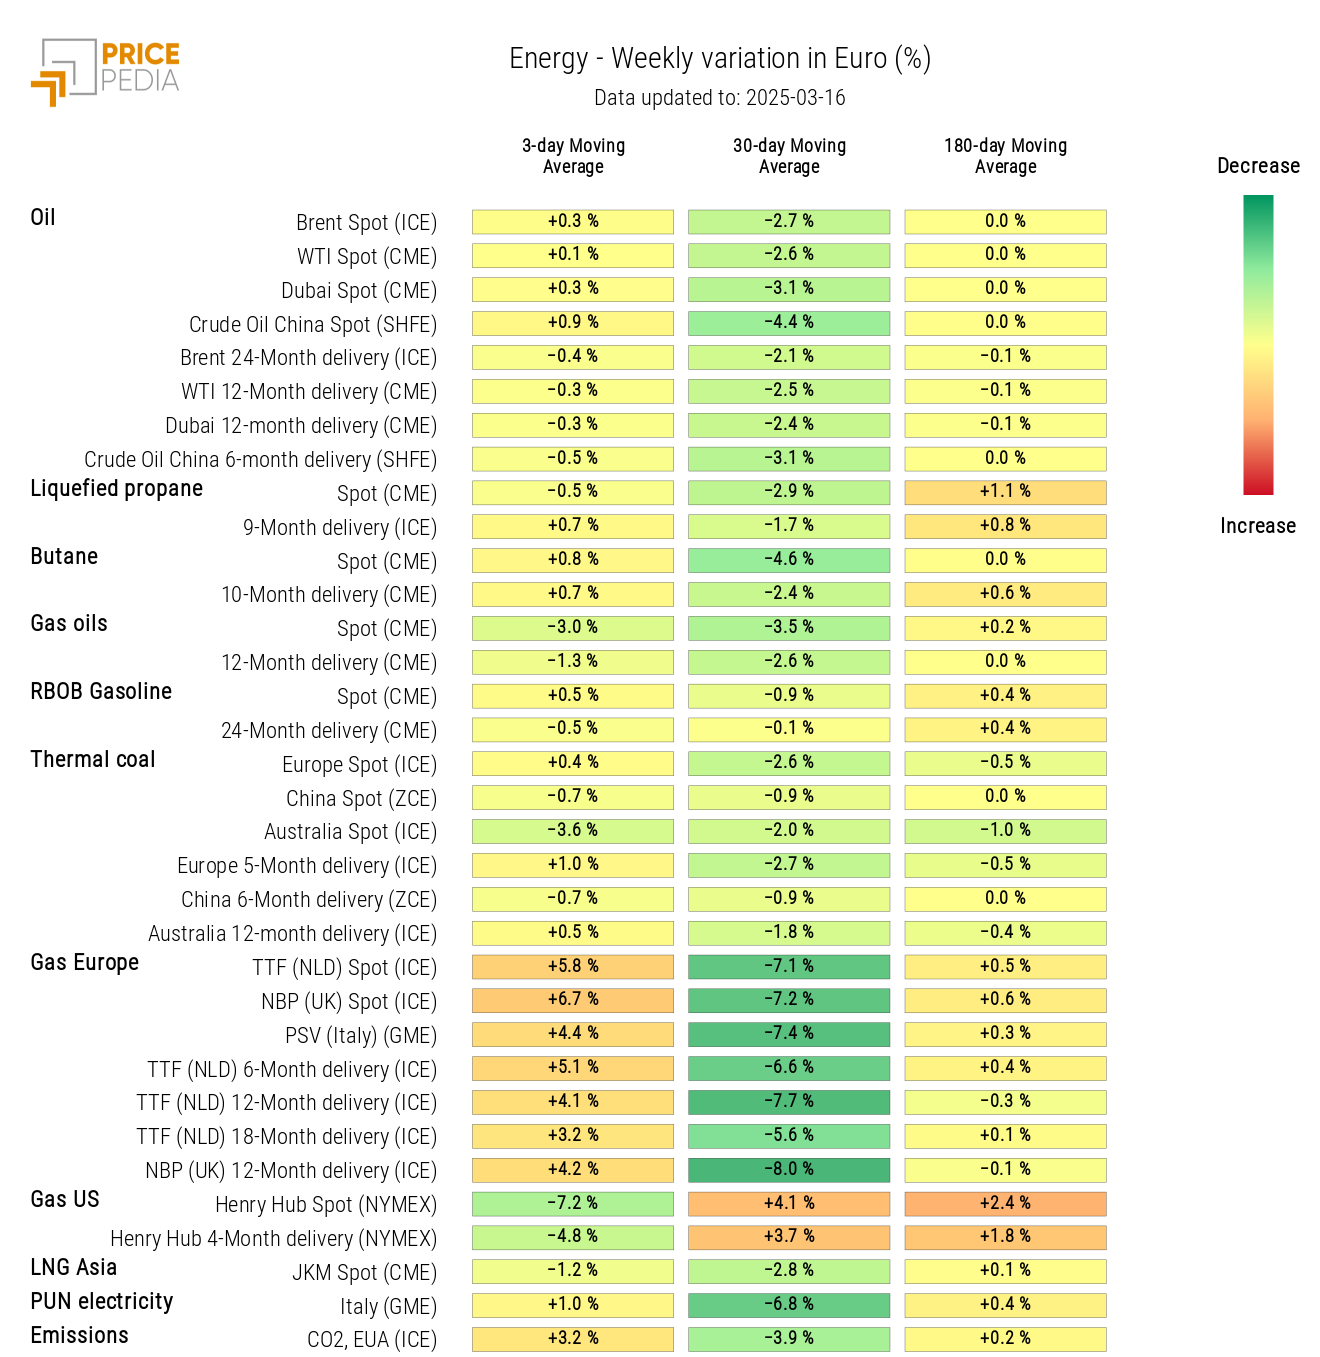
This week, the PricePedia energy product index recorded opposing price movements.
PricePedia Financial Index of Energy Prices in Dollars
The energy heatmap highlights a decline in U.S. natural gas prices, while European prices increased.
HeatMap of Energy Prices in Euros
PLASTICS
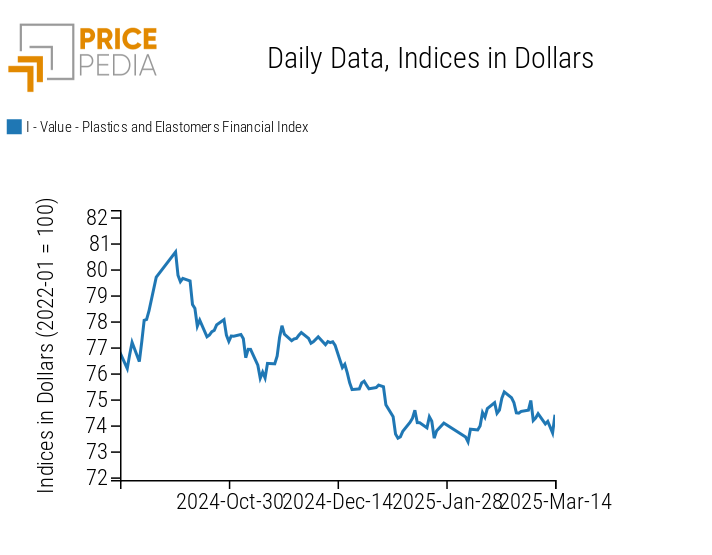
The financial index of plastics and Chinese elastomers continues a phase of price reduction.
PricePedia Financial Indices of Plastic Prices in Dollars
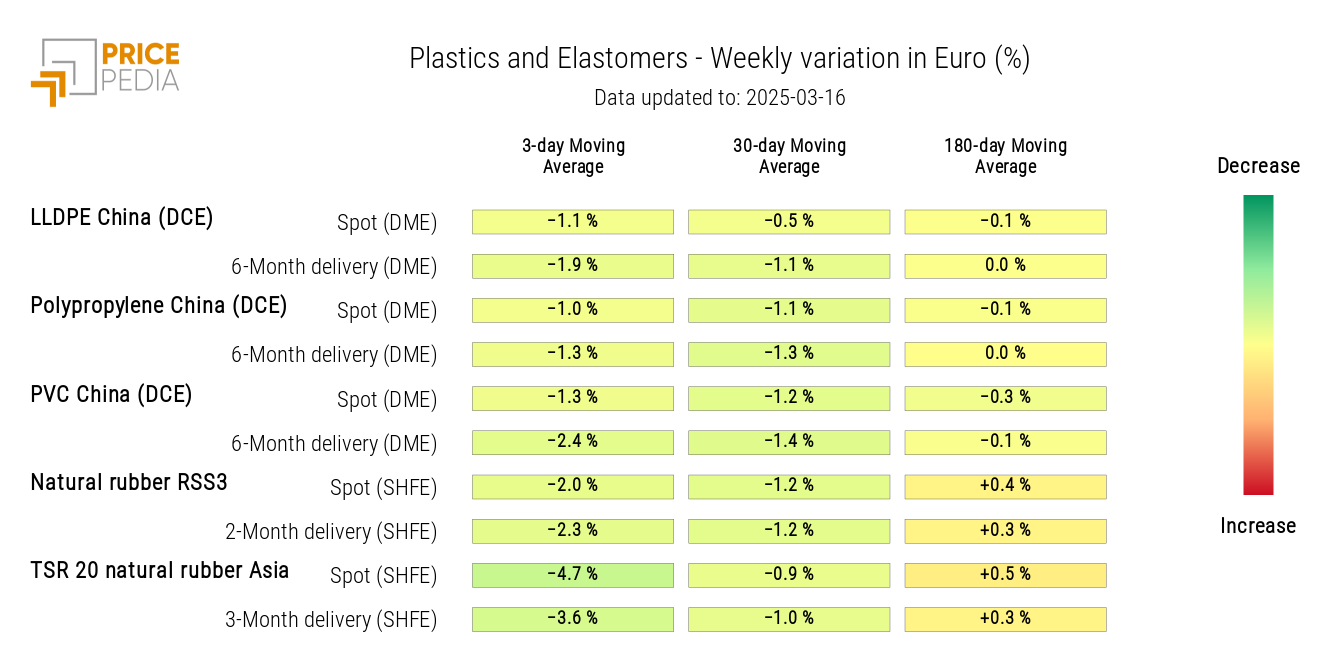
The heatmap highlights a general decline in prices, more pronounced for TSR 20 natural rubber in Asia.
HeatMap of Plastic and Elastomer Prices in Euros
FERROUS
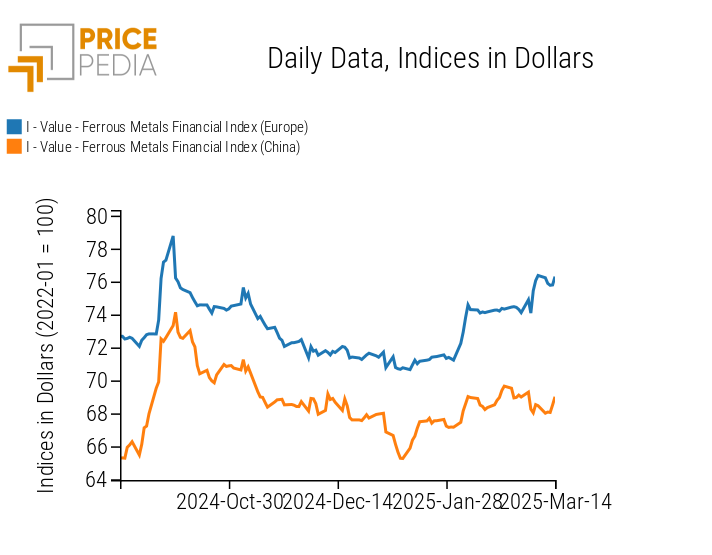
The financial indices of ferrous metals remain overall stable, with the European index slightly declining and the Chinese index characterized by weak fluctuations.
PricePedia Financial Indices of Ferrous Metal Prices in Dollars
Do you want to stay up-to-date on commodity market trends?
Sign up for PricePedia newsletter: it's free!
INDUSTRIAL NON-FERROUS
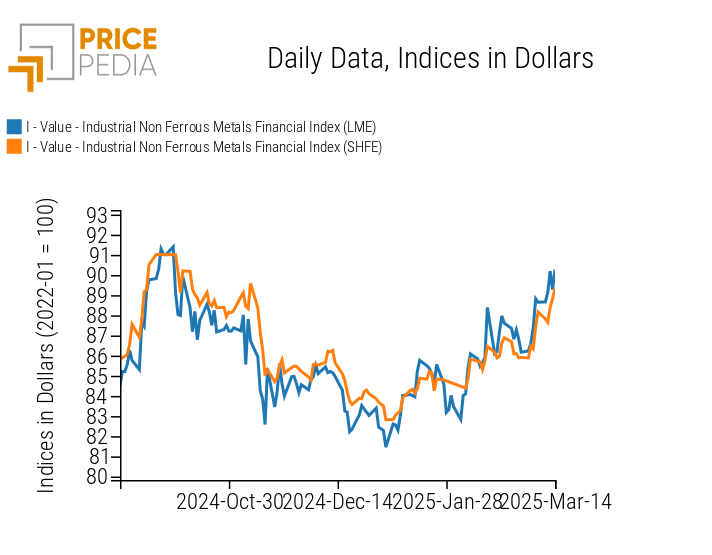
Both non-ferrous indices show price fluctuations while maintaining an upward trend.
PricePedia Financial Indices of Industrial Non-Ferrous Metal Prices in Dollars
The heatmap analysis highlights a sharp increase in LME cobalt financial prices.
HeatMap of Non-Ferrous Prices in Euros
FOOD
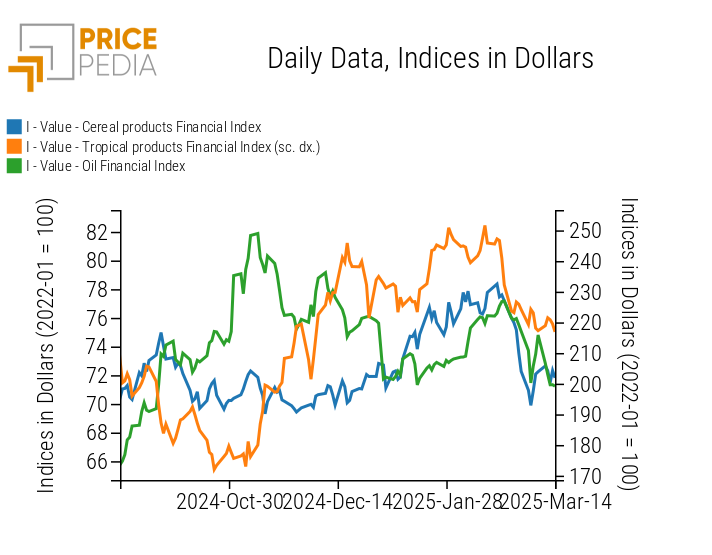
The index of edible oils shows a price decline, while those of cereals and tropical commodities display contrasting fluctuations.
PricePedia Financial Indices of Food Prices in Dollars
CEREALS
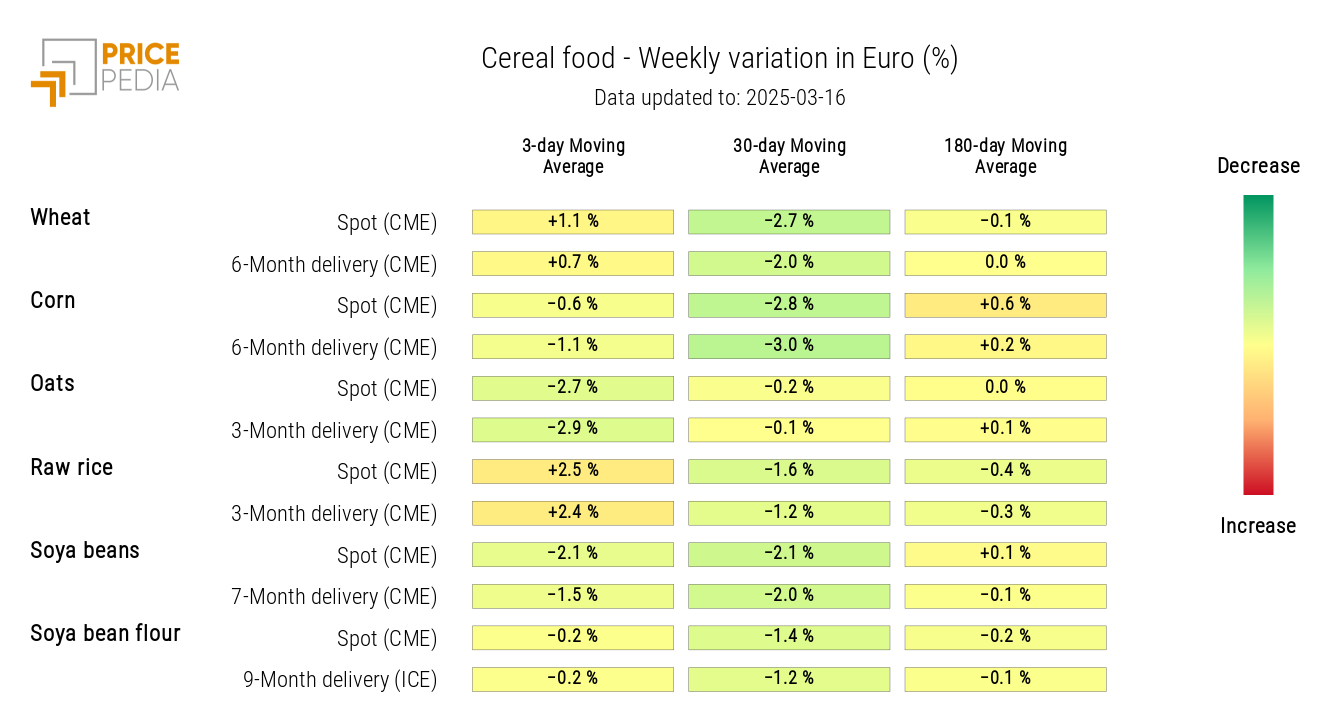
The cereals heatmap reveals a rise in rough rice prices and a decline in oat and soybean seed prices.
HeatMap of Cereal Prices in Euros
TROPICAL
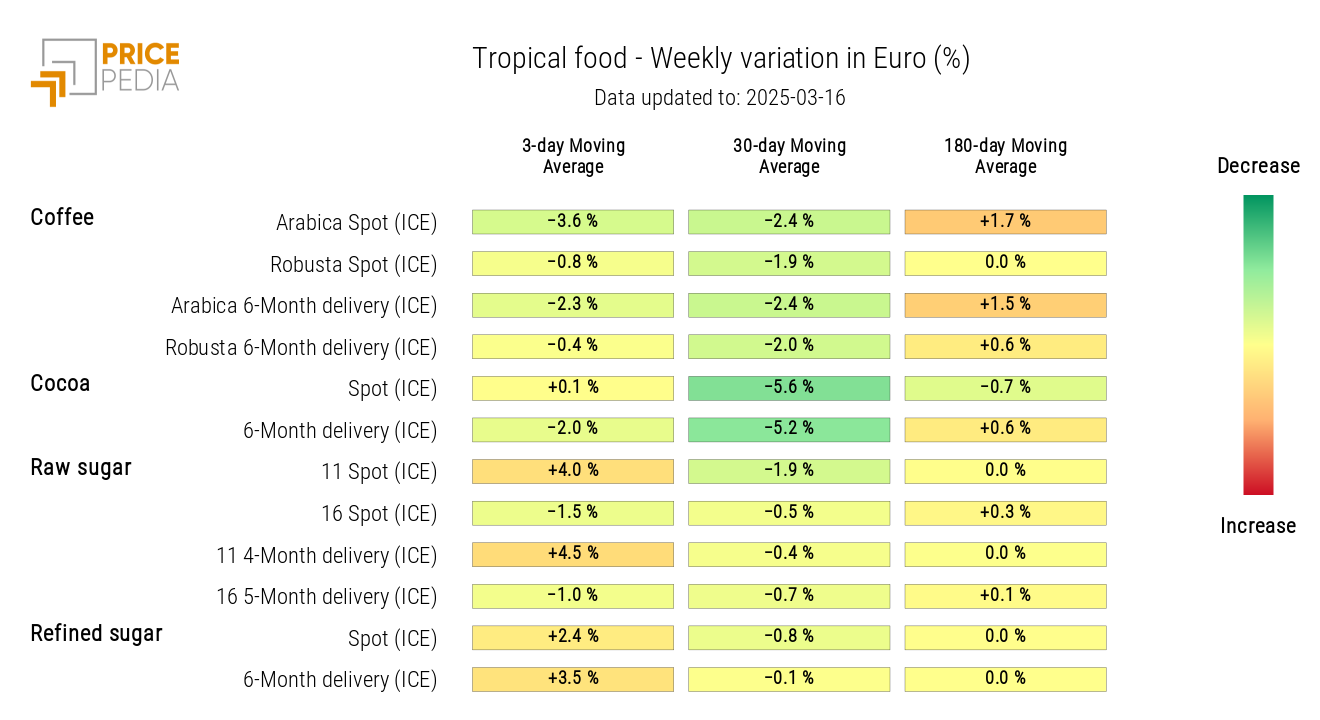
The tropical commodities heatmap indicates an increase in sugar prices.
HeatMap of Tropical Food Prices in Euros
OILS
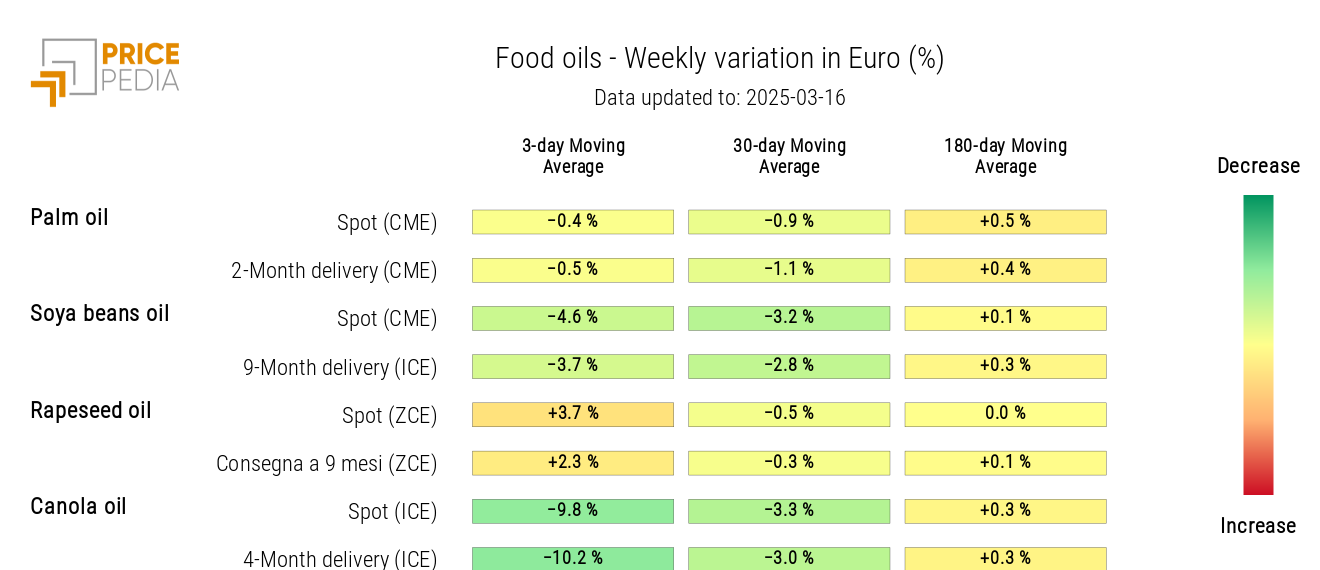
The oils heatmap highlights a sharp decline in canola oil prices.
HeatMap of Edible Oil Prices in Euros
