Shock in energy markets over tensions between U.S. and Iran
Growth in energy prices is associated with growth in nonferrous metals
Published by Luca Sazzini. .
Conjunctural Indicators Commodities Financial WeekWeekly Summary of Commodity Financial Prices
This week saw high volatility in energy commodity prices, mainly due to geopolitical and trade tensions.
On Monday, oil prices rose following U.S. airstrikes against Houthi rebels over the past weekend, aiming to ensure the safety of shipping routes in the Red Sea. The military campaign could last for weeks, and President Trump warned Iran that it would be held accountable and face consequences if the Houthis continued attacks on transiting ships in the Red Sea.
In the following days, the oil market fluctuated in response to different reports on U.S. stockpiles: on Tuesday, oil prices fell after the American Petroleum Institute (API) reported an inventory increase of 4.59 million barrels, whereas on Wednesday, the Energy Information Administration (EIA) indicated a smaller rise of 1.75 million barrels, helping prices recover. On Thursday, the upward trend intensified after the U.S. imposed sanctions on the Iranian shadow fleet of Chinese tankers, known as teapot, supplying certain refineries. Notably, the sanction against the Chinese refinery Shandong Shouguang Luqing Petrochemical Co., Ltd and its CEO for purchasing Iranian crude oil caused significant reaction.
An additional bullish push came from the announcement of the new OPEC+ production cut program, aimed at compensating for the overproduction recorded in previous months. While these cuts may offset the expected supply increase starting in April, it remains to be seen whether the organization’s members will adhere to their commitments, considering that some countries continue to produce above the agreed levels.
In the European natural gas market, TTF prices started the week on a downward trend in anticipation of a peace agreement between Russia and Ukraine. However, on Wednesday, they surged by more than 6% as Russia did not accept an unconditional ceasefire. The current agreement only covers the suspension of attacks on energy infrastructure and is valid for 30 days.
In the U.S. Henry Hub gas market, the most significant weekly movement occurred on Thursday, with a drop of over 6% following EIA data indicating a larger-than-expected increase in U.S. gas storage.
In the metals market, gold continues to reach new highs, while industrial metals mostly followed a sideways trend, especially for European ferrous metals. Among Chinese ferrous metals, however, prices for iron ore and wire rod declined.
Among non-ferrous metals,
the price of tin has continued to rise, increasing by 19% since early 2025, while copper prices have also gained support from positive macroeconomic data from China and the announcement of a special action plan to boost consumption by the Chinese government, aiming to stimulate a recovery in domestic demand.
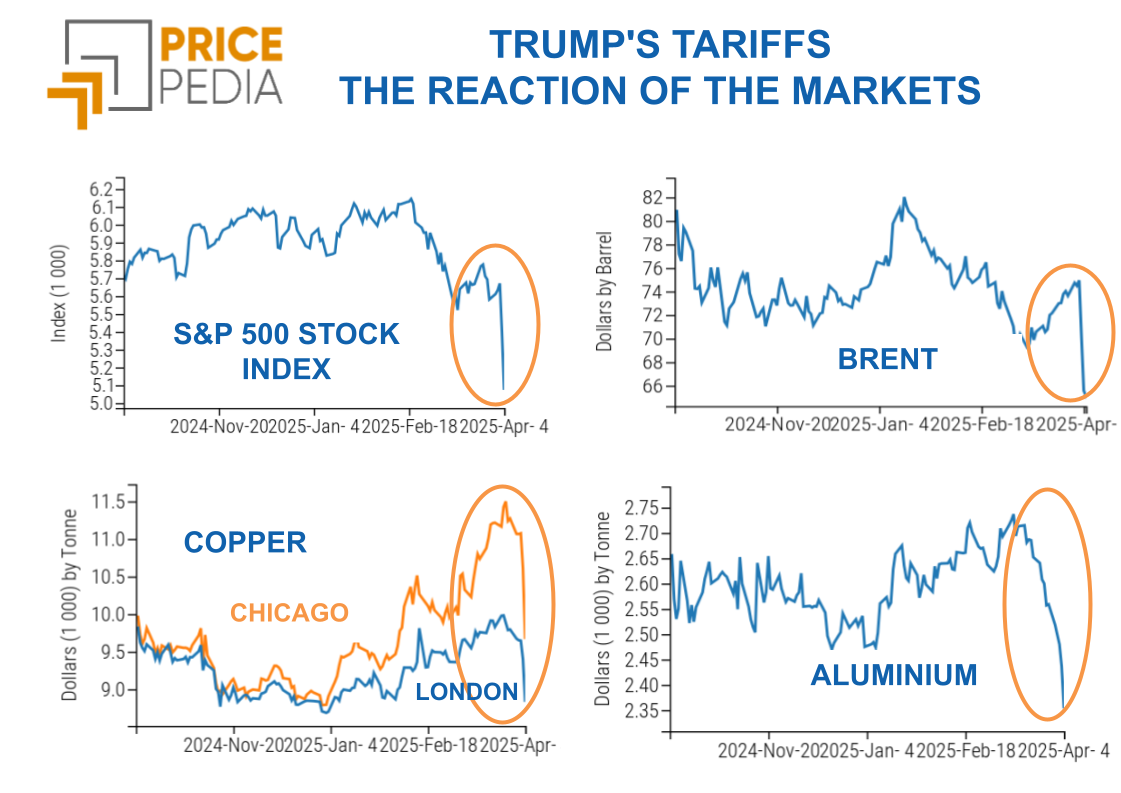
Below are the financial price dynamics of copper traded on the Chicago, London, and Shanghai exchanges.
Comparison of Financial Copper Prices, in Dollars per Ton

The chart analysis highlights a general rise in copper prices, particularly in the U.S. market, where Chicago prices have surpassed those on the Shanghai exchange, which, unlike the other two, includes VAT and other taxes.
The stronger increase in U.S. financial prices is mainly attributed to concerns over imminent sanctions on copper, already announced by the Trump administration.
In the aluminum market, however, no significant changes were recorded despite the European Union's announcement of an investigation to assess safeguard measures to protect the domestic industry, threatened by growing international competition due to U.S. tariffs.
Regarding tariffs, the European measures on U.S. imports have been postponed to facilitate new negotiations.
After last week's sharp increase, cobalt prices have stabilized with a weakening trend in the last few days due to profit-taking.
In the food sector, financial prices of sugar have risen due to downward revisions in production estimates for Brazil and India caused by dry weather conditions.
Federal Reserve Monetary Policy
As anticipated in last week's article: Amid duties and uncertainties, gold takes center stage, the Federal Reserve (FED) has kept interest rates unchanged at 4.25 - 4.50%.
The key announcement from the March FOMC meeting was the slowdown in the pace of the FED's balance sheet reduction. Starting in April, the amount of Treasuries not reinvested will be reduced from $25 billion to a maximum of $5 billion, thus draining less liquidity from the market.
The keyword during Jerome Powell's press conference was "uncertainty," mainly related to the new U.S. trade policy. The final impact of this new trade policy on U.S. inflation remains difficult to quantify, but the FED estimates it to be a temporary effect.
Inflation growth forecasts have been significantly revised upwards for 2025, while they remain almost unchanged for the following two years, with the 2% target expected to be reached by the end of 2027. This year, headline PCE index projections have risen from 2.5% to 2.7%, while the core index[2] increased from 2.5% to 2.8%.
Forecasts for U.S. GDP growth have been revised downward for all three upcoming years, with the 2025 estimate lowered from 2.1% to 1.7%.
The FED chairman acknowledged a decline in consumer and business confidence but reaffirmed that the U.S. economy remains solid. If a significant weakening of the labor market occurs, the Federal Reserve could always cut interest rates, even if inflation temporarily rises.
[1] The FED's forecasts do not incorporate significant effects from potential retaliatory measures by trade partners.
[2] Core index refers to inflation excluding food and energy prices.
NUMERICAL APPENDIX
ENERGY
The PricePedia index of energy product prices exhibits a fluctuating trend, with a sharper increase on Thursday following new U.S. sanctions against the Chinese refinery Shandong Shouguang Luqing Petrochemical Co., Ltd and the Iranian shadow fleet of Chinese tankers.
PricePedia Financial Index of Energy Prices in USD

The PricePedia energy heatmap highlights a general price increase, with a more pronounced rise in the price of Italian electricity (PUN).
HeatMap of Energy Prices in EUR

PLASTIC MATERIALS
The financial index of Chinese plastics and elastomers indicates a price decline, mainly due to the drop in LLDPE, traded on the Dalian Commodity Exchange (DCE).
PricePedia Financial Indices of Plastic Prices in USD

FERROUS METALS
The financial index of ferrous metals in the Chinese market is experiencing a price contraction, while the European market remains more stable.
PricePedia Financial Indices of Ferrous Metal Prices in USD

The heatmap analysis highlights the price decline of wire rod and Chinese iron ore (DCE).
HeatMap of Ferrous Prices in EUR

Do you want to stay up-to-date on commodity market trends?
Sign up for PricePedia newsletter: it's free!
INDUSTRIAL NON-FERROUS METALS
The financial price indices of non-ferrous metals show some fluctuations, but these do not alter the ongoing growth trend that has characterized the average non-ferrous prices since early 2025.
PricePedia Financial Indices of Industrial Non-Ferrous Metal Prices in USD

The heatmap highlights cobalt as the main driver of the non-ferrous index price increase.
The weekly rise in the three-day moving average, however, is mainly due to a "carry-over" effect from last week's growth.
Significant growth was recorded this week in the price of tin and, to a slightly lesser extent, in the price of copper.
HeatMap of Non-Ferrous Prices in EUR

FOOD
Despite some fluctuations, a weekly price increase is observed in food indices, especially for cereals.
PricePedia Financial Indices of Food Prices in USD

CEREALS
The cereal heatmap highlights a positive weekly variation in the three-day moving average prices of wheat, corn, oats, and soybean seeds.
HeatMap of Cereal Prices in EUR

TROPICAL PRODUCTS
The tropical products heatmap reveals a rise in financial sugar prices, driven by lower production estimates in Brazil and India due to dry weather conditions.
HeatMap of Tropical Food Prices in EUR

OILS
The edible oil heatmap indicates a price increase in soybean oil.
HeatMap of Edible Oil Prices in EUR

You may be interested in:

Transfer of US-China tensions from trade to financial flows
Published by Luca Sazzini. .
Conjunctural Indicators Commodities Financial WeekMarkets under stress: how Trump's tariffs affect financial price fluctuations [ Read all ]
Liberation or Ruination Day? A storm of tariffs on commodity markets
Published by Luca Sazzini. .
Conjunctural Indicators Commodities Financial WeekFinancial markets fail U.S. protectionist policy [ Read all ]

Commodities in check since Trump's annnucials
Published by Luca Sazzini. .
Conjunctural Indicators Commodities Financial WeekFaced with uncertainty, investors find refuge in gold [ Read all ]