Commodities in check since Trump's annnucials
Faced with uncertainty, investors find refuge in gold
Published by Luca Sazzini. .
Conjunctural Indicators Commodities Financial WeekWeekly Summary of Financial Commodity Prices
In last week's article: Shock in energy markets over tensions between U.S. and Iran, a rise in oil prices was recorded following Trump's announcement about sanctions on Iran's shadow fleet of Chinese tankers and the Shandong Shouguang Luqing Petrochemical Co., Ltd refinery for purchasing Iranian crude oil.
This week, the upward trend in oil prices continued, exacerbated by further trade threats from the United States. President Donald Trump announced a 25% tariff on all countries that import oil or gas from Venezuela. This measure will take effect on April 2nd and aims to sanction Venezuela, which Trump accuses of sending thousands of criminals to the United States. These new tariffs could escalate the trade war, especially between the United States and China, as China is considered the main recipient of Venezuelan oil.
At the same time, the U.S. administration also announced a 25% tariff on automobile imports, which will also take effect on April 2nd, further intensifying global trade tensions.
In the European natural gas market TTF (Netherlands), prices experienced a more significant drop at the beginning of the week, with a decrease of -3% on Monday and -2% on Tuesday. This contraction was primarily caused by the increase in solar and wind energy production, which reduced the demand for natural gas for electricity generation. Subsequently, TTF prices partially recovered.
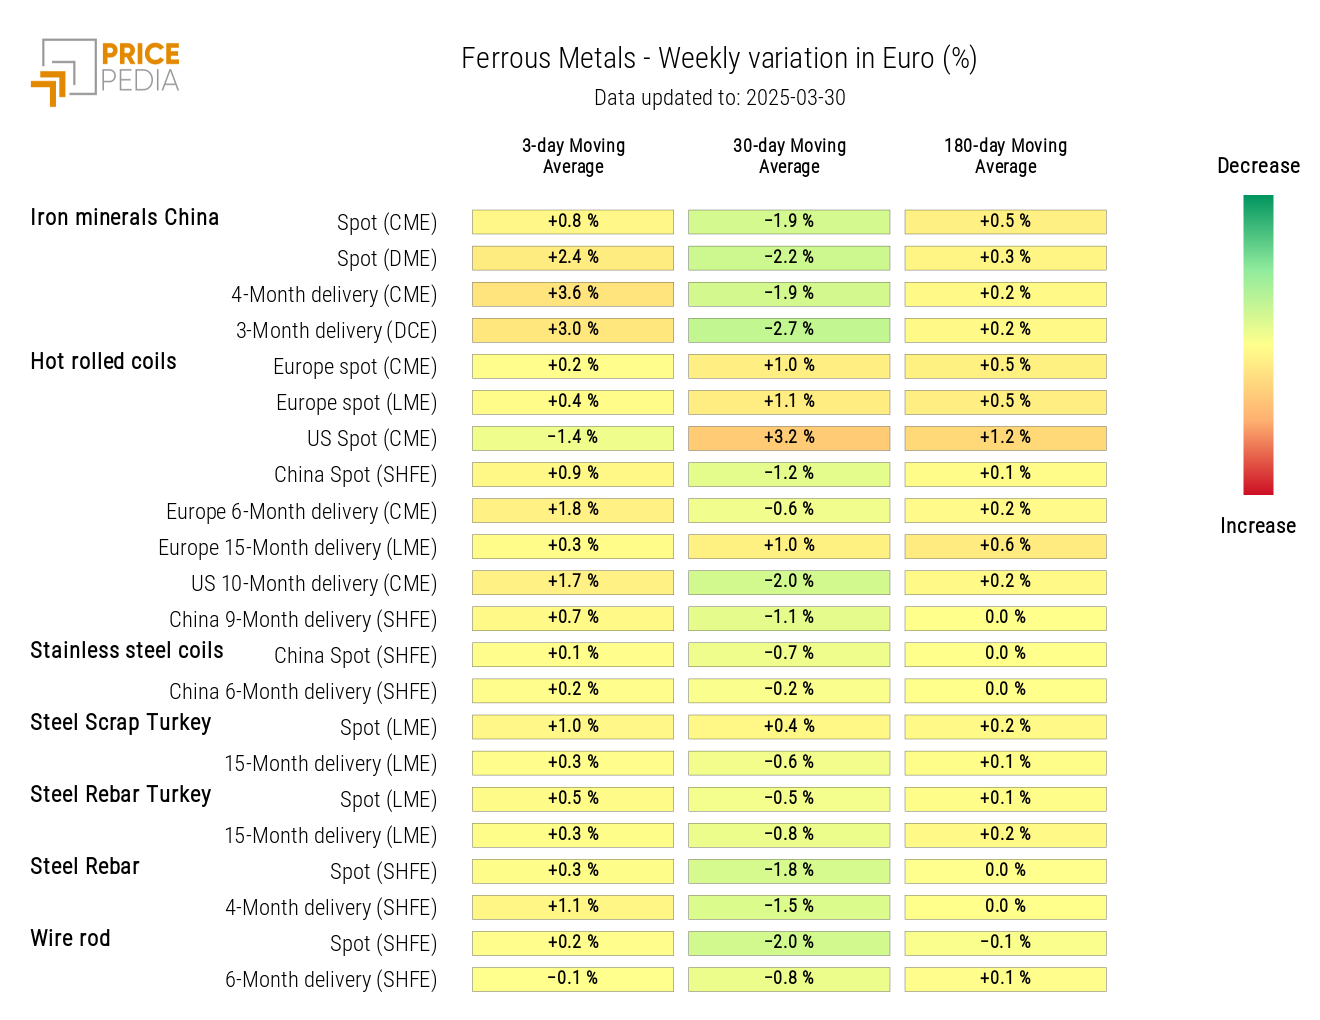
In the metals market, safe-haven assets such as gold and silver continue to see new increases, supported by high uncertainty related to trade and geopolitical tensions. On the other hand, industrial metals are showing greater stability, with some exceptions. In the ferrous metals market, the biggest weekly change was seen in Chinese iron ore, which saw a rise due to the increased demand for steel in China.
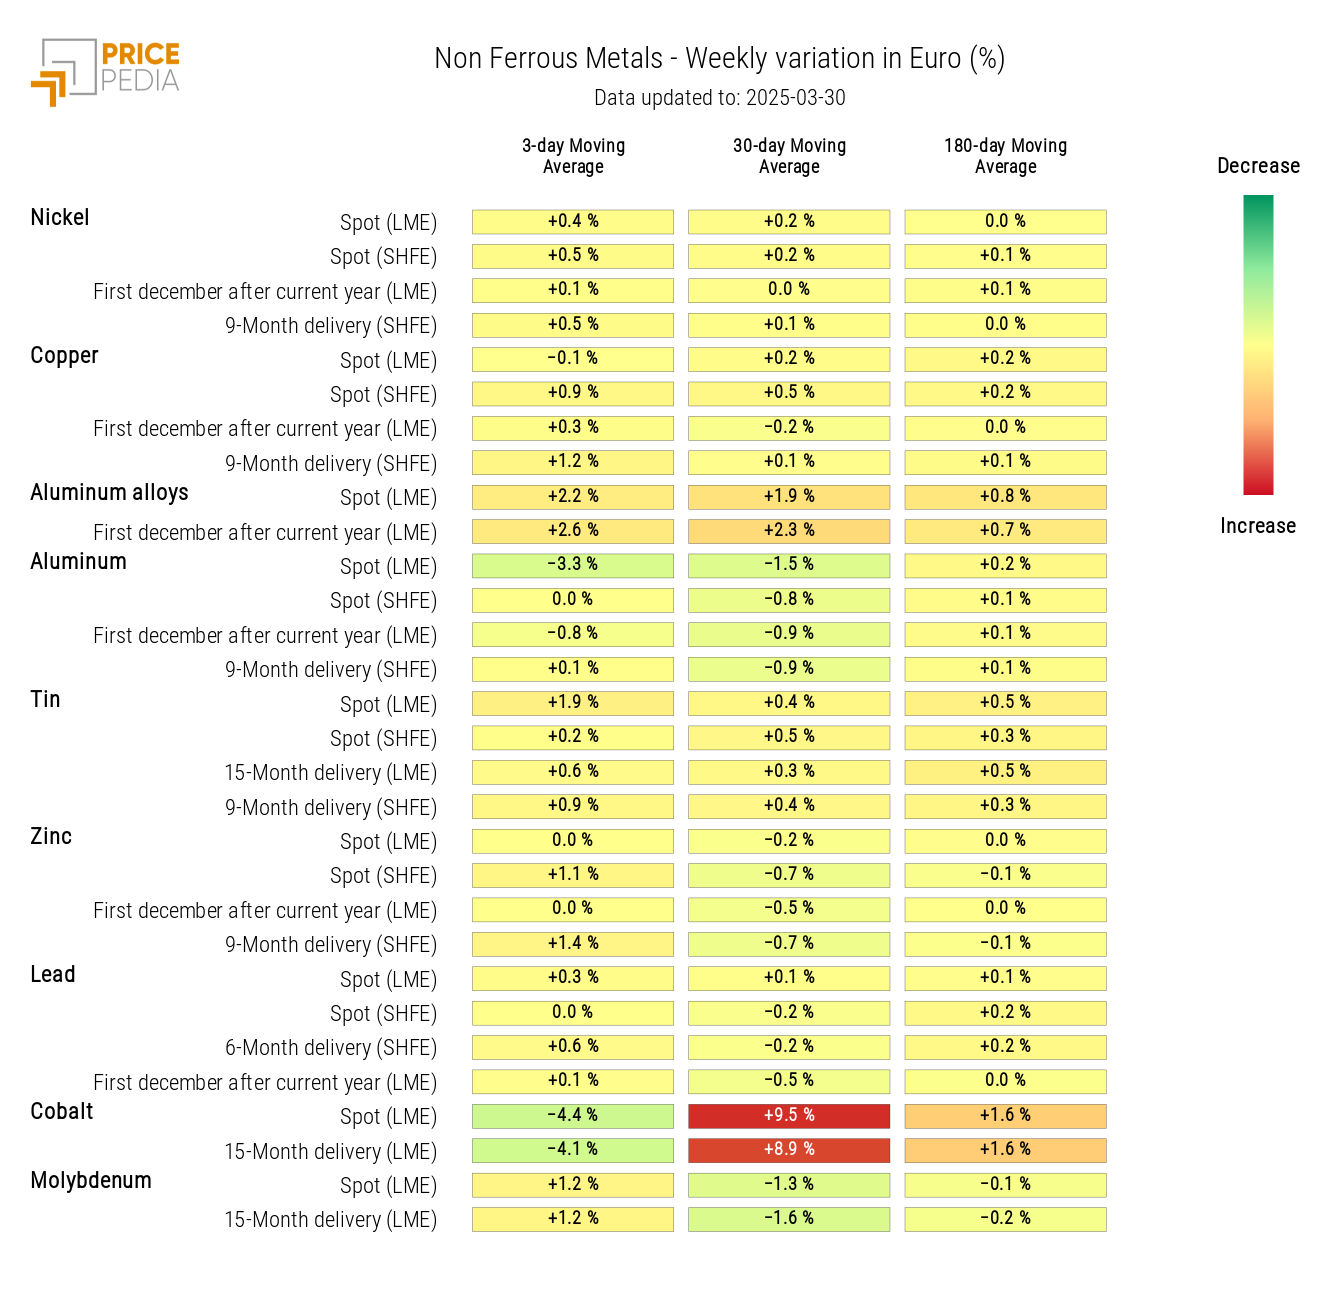
In the non-ferrous metals market, there was an oscillating dynamic, with a more pronounced reduction in prices on the London Metal Exchange (LME) compared to the Shanghai Futures Exchange (SHFE). The most significant drop occurred in the cobalt market, where recent price increases led to the suspension of trading on the Wuxi Stainless Steel Exchange.[1]
Another price drop was recorded in the aluminum market, following Arrow Minerals' announcement regarding the initial mineral resource estimate for its bauxite (aluminum ore) project in Guinea. The company estimated an initial resource of approximately 185 million tons, with an average of 42.3% alumina and 2.7% silica.
Another price to monitor is copper CME, which at the beginning of the week widened its spread compared to LME and SHFE quotes, as a result of the potential tariffs that the Trump administration might impose on refined copper imports.
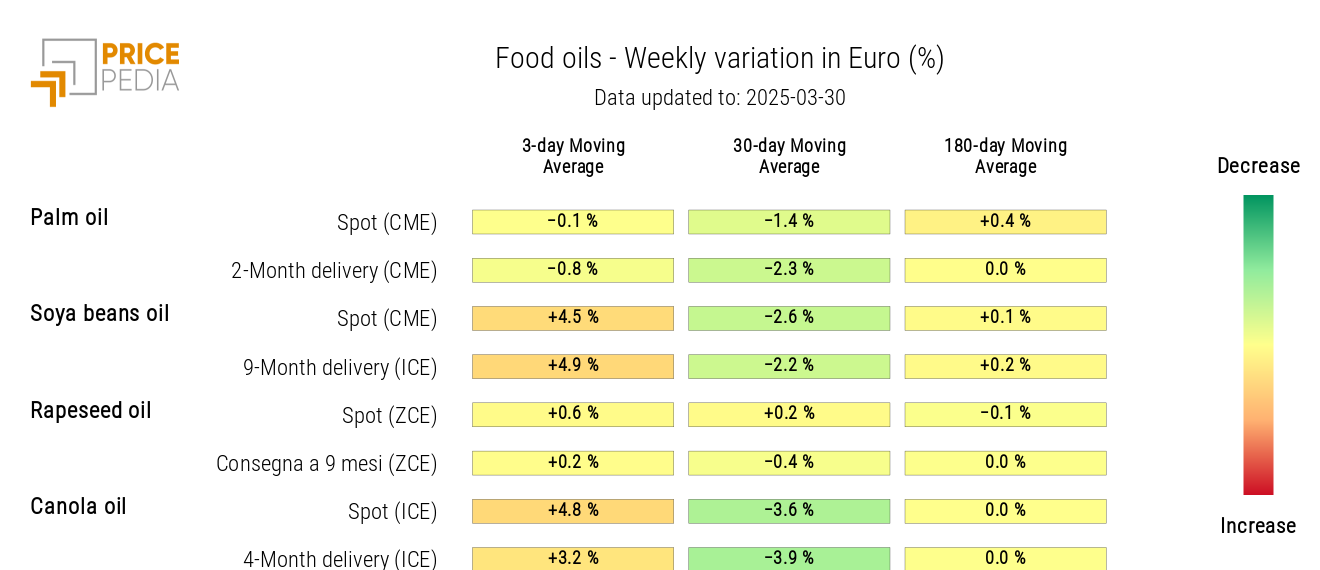
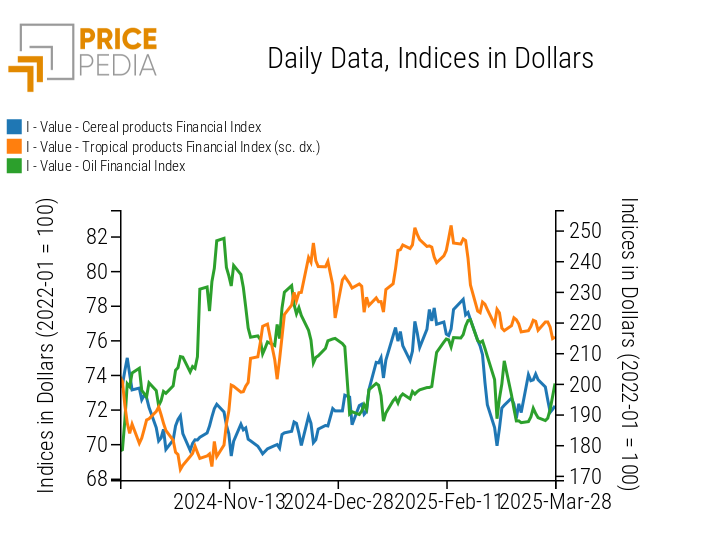
In the food market, there was a weekly contraction in the prices of cereals and tropical commodities, while oils saw a rise.
PMI
The flash estimates of the Purchasing Managers' Index (PMI) for March indicated economic growth for both Europe and the United States, with some common factors but also many differences. In both sides of the Atlantic, growth is driven by services, while manufacturing is weaker, especially in the Eurozone. While in the United States the gap between services and industry is widening, in Europe it is narrowing, mainly due to the weakening of services. In the Eurozone, overall growth was below expectations, while in the United States it exceeded analysts' forecasts.
Below are the detailed results of the flash PMI estimates for both economies.
Eurozone
In Europe, the composite PMI rose from 50.2 to 50.4, but it was below analysts' expectations, which were 50.8.
The more limited growth compared to expectations is mainly attributed to the decline in the services PMI, which, instead of staying unchanged as expected at 51.2, decreased to 50.4.
The increase in the composite PMI, compared to the previous month, is attributed to a rise in the manufacturing PMI, which increased to 48.7 from the expected 48.3 and the February figure of 47.6.
Although this data was better than expected, it confirms that European manufacturing remains in difficulty. In fact, a PMI below 50 points indicates a contraction for the sector. Conversely, a PMI above 50 points signals economic growth.
United States
The composite PMI for the United States in March rose to 53.5, up from 51.6 in February. This increase was entirely driven by an unexpected improvement in the services PMI, which rose to 54.3, well above the expected 51.2 and significantly up from the February reading (51 points).
On the other hand, the manufacturing PMI recorded a larger-than-expected contraction, falling to 49.8, below the February data of 52.7 and the forecast of 51.9.
Overall, the U.S. PMI data confirms a strong economy, especially in the services sector, but shows a slight weakness in manufacturing.
U.S. Inflation
The U.S. core PCE index data, released on Friday, March 28, showed an unexpected rise in inflation. In February, the index increased by 0.4% compared to the previous month, surpassing both the January growth (0.3% m/m) and analysts' expectations (0.3%).
Year-on-year, the core PCE index grew by 2.8%, up from both expectations and the previous month's figure, which were both 2.7% y/y. These data spooked the U.S. stock markets, which experienced a decline after their release. Investors fear that a potential rise in prices, fueled by U.S. protectionist policies, could delay the next rate cut by the Federal Reserve (FED).
[1] For more details on the rise in cobalt prices, see the article: Amid duties and uncertainties, gold takes center stage.
NUMERICAL APPENDIX
ENERGY
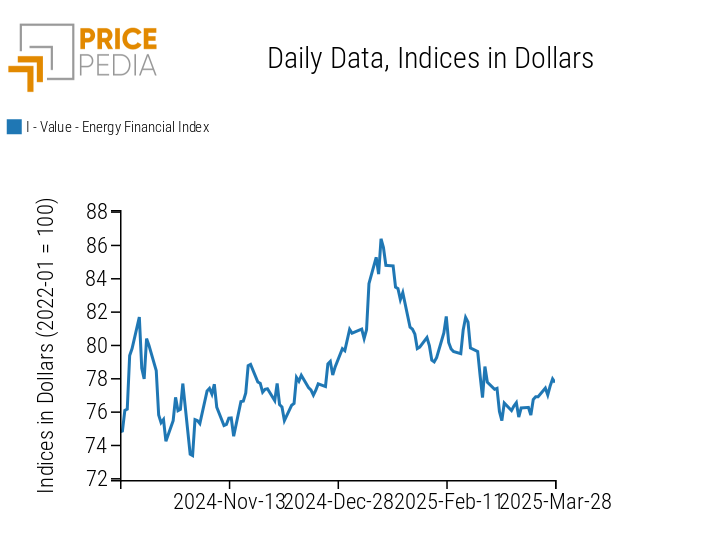
The PricePedia energy index shows a price increase mainly due to actions threatened by the Trump administration.
PricePedia Financial Index of energy prices in dollars
PricePedia's energy heatmap highlights an increase in oil prices, while natural gas prices in Europe decreased due to the rise in wind and solar energy production.
Energy price heatmap in euros

PLASTICS
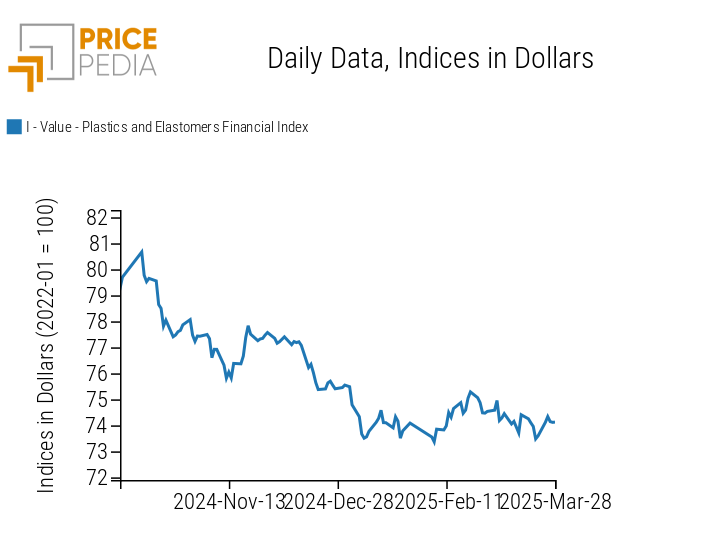
The financial index of Chinese plastics and elastomers indicates a price recovery in the first days of the week, followed by a slight turnaround.
PricePedia Financial Indices of plastic prices in dollars
FERROUS
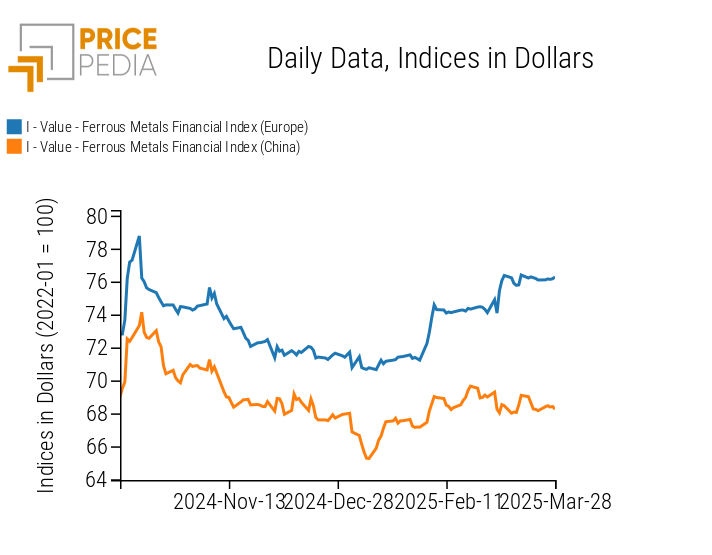
The two indices of ferrous metals both follow a sideways weekly trend.
PricePedia Financial Indices of ferrous metal prices in dollars
The heatmap analysis highlights the increase in Chinese iron ore prices quoted on the Dalian Commodity Exchange (DCE).
HeatMap of ferrous prices in euros
Do you want to stay up-to-date on commodity market trends?
Sign up for PricePedia newsletter: it's free!
NON-FERROUS INDUSTRIALS
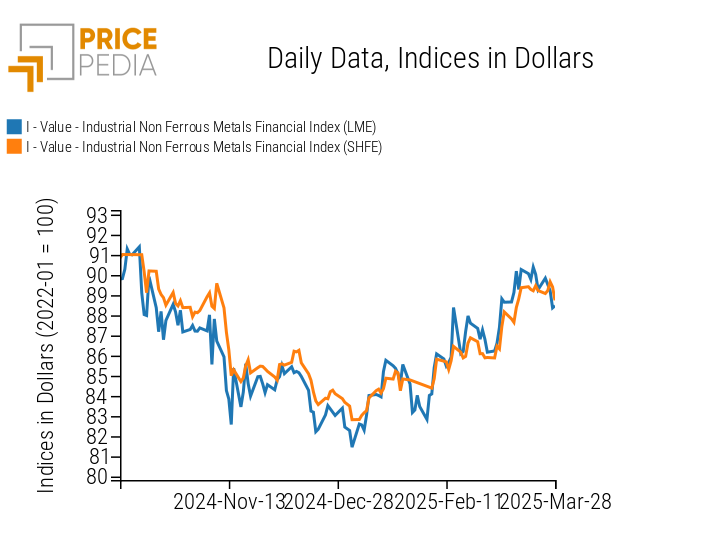
Excluding some weekly fluctuations, the London Metal Exchange (LME) non-ferrous metal price index decreases further, falling below the Shanghai Futures Exchange (SHFE) index.
PricePedia Financial Indices of non-ferrous industrial metal prices in dollars
The non-ferrous heatmap shows a weekly reduction in cobalt and aluminum prices.
HeatMap of non-ferrous prices in euros
FOOD PRODUCTS
Excluding some fluctuations, there is a weekly decline in the cereal and tropical products index, alongside growth in the oils index.
PricePedia Financial Indices of food prices in dollars
CEREALS
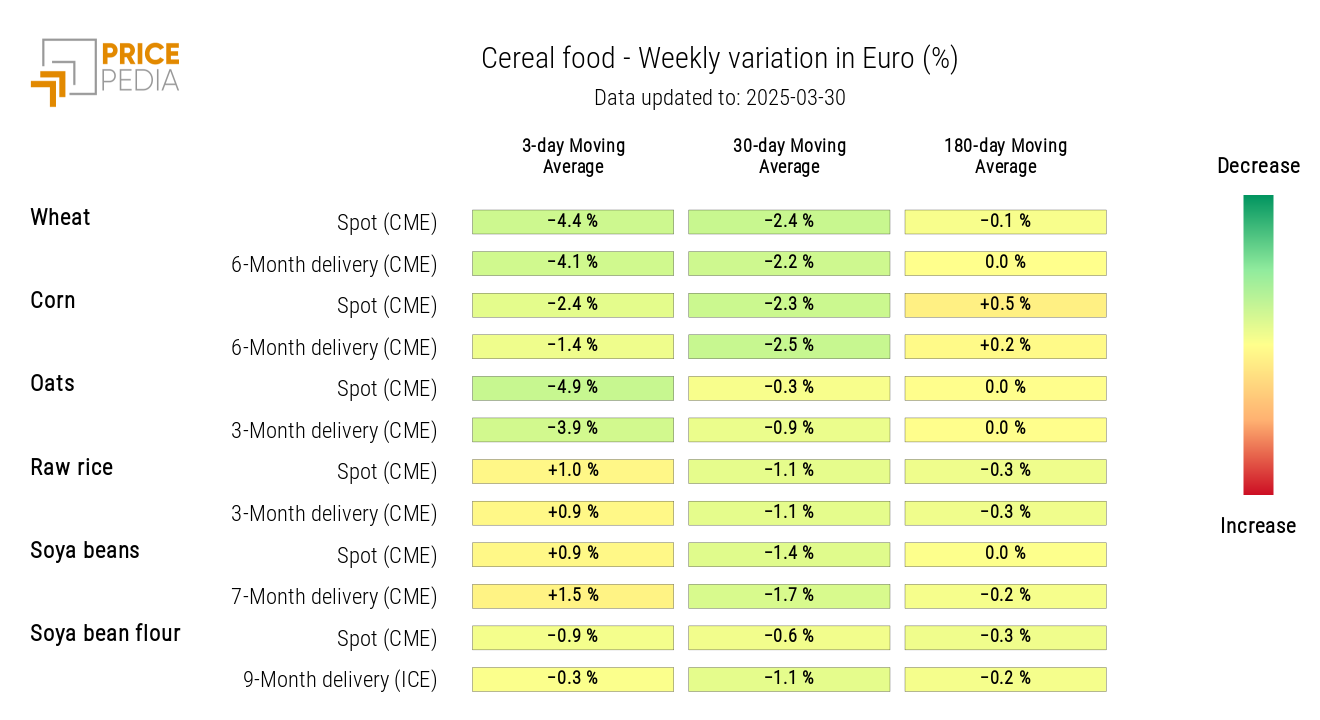
The cereals heatmap shows a weekly decline in the financial prices of wheat and oats.
The reduction in wheat prices is partly attributed to the increased production announced by the Ukrainian Ministry of Agriculture.
HeatMap of cereal prices in euros
TROPICAL PRODUCTS
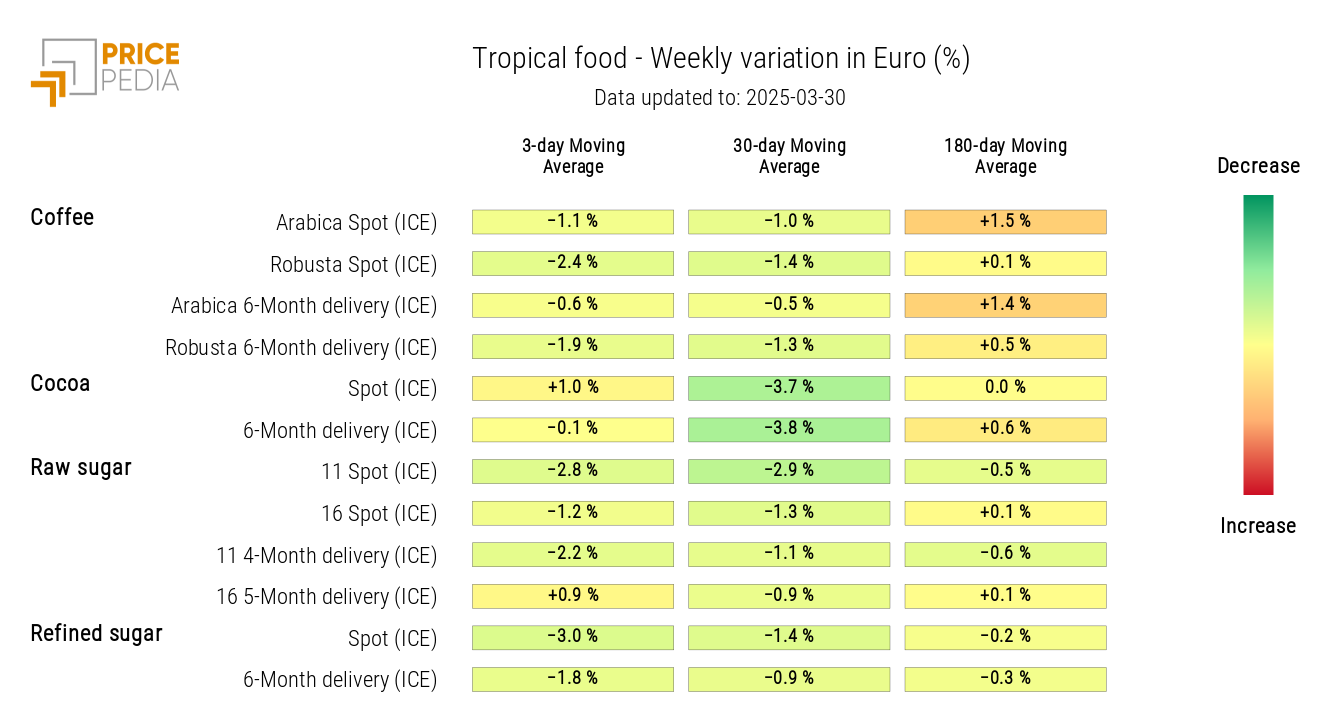
The tropical heatmap reveals a reduction in the prices of robusta coffee and sugar.
HeatMap of tropical food prices in euros
OILS
The food oils heatmap indicates a price increase in canola oil and soybean oil.
HeatMap of food oil prices in euros
