Monthly commodity prices update for March 2025
Price stability: counterbalancing forces or statistical randomness?
Published by Pasquale Marzano. .
Last Price Global Economic TrendsThe monthly update of PricePedia commodity prices for March 2025 has been published. The following graph shows the price evolution in euros of raw materials in Europe for the main PricePedia aggregates: Commodity[1], Industrials[2], Energy and Food, with base 100 for their respective levels of January 2022.
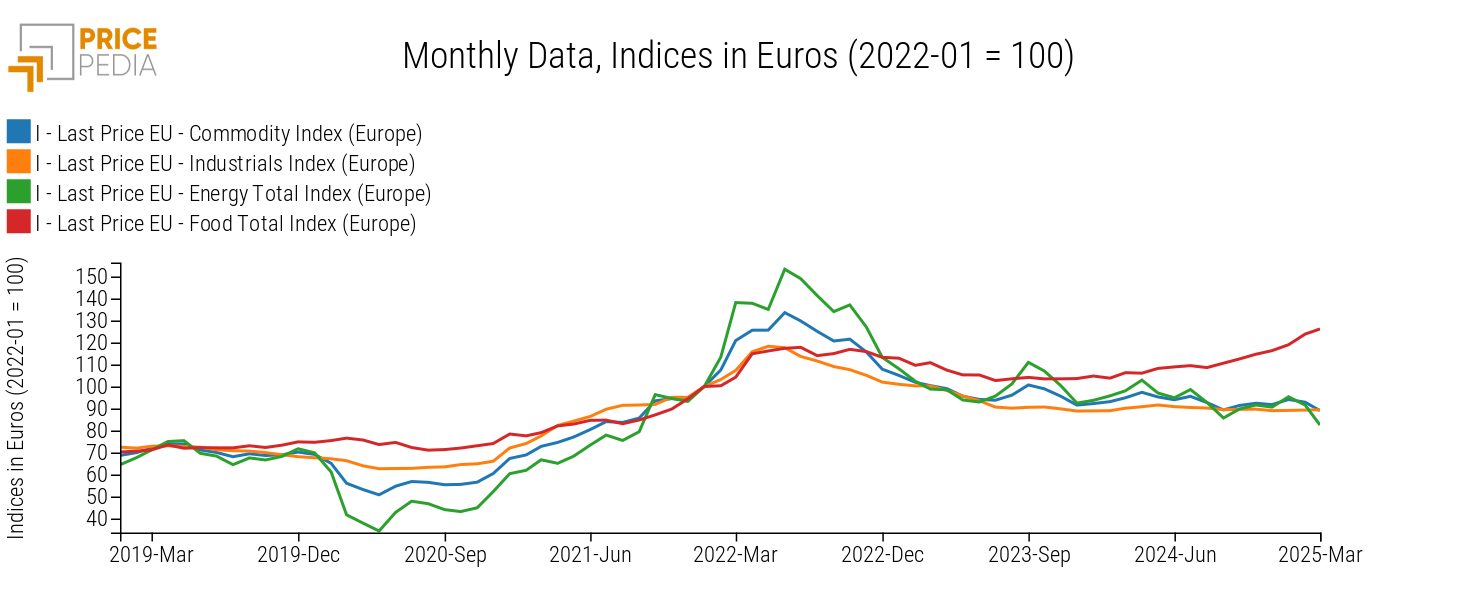
In March 2025, the euro-denominated prices of energy commodities experienced an average decrease of -10%, more than offsetting January's increase due to geopolitical tensions and, in the case of natural gas, higher seasonal consumption.
As for the euro-denominated prices of food commodities, the upward trend continued, with a +1.4% increase in March, though slowing down compared to the previous month.
In an economic phase characterized by uncertainty, an opposing trend is emerging in industrial commodity markets: a price stability never seen before.
It is useful to point out that this stability mainly concerns prices in euros, as those in dollars have shown significant variations. Specifically, between September 2024 and January 2025, dollar prices fell by -7%, while the dollar appreciated against the euro by a similar percentage. Similarly, over the past two months, dollar prices rose by +5%, offset in euros by an equivalent dollar depreciation.
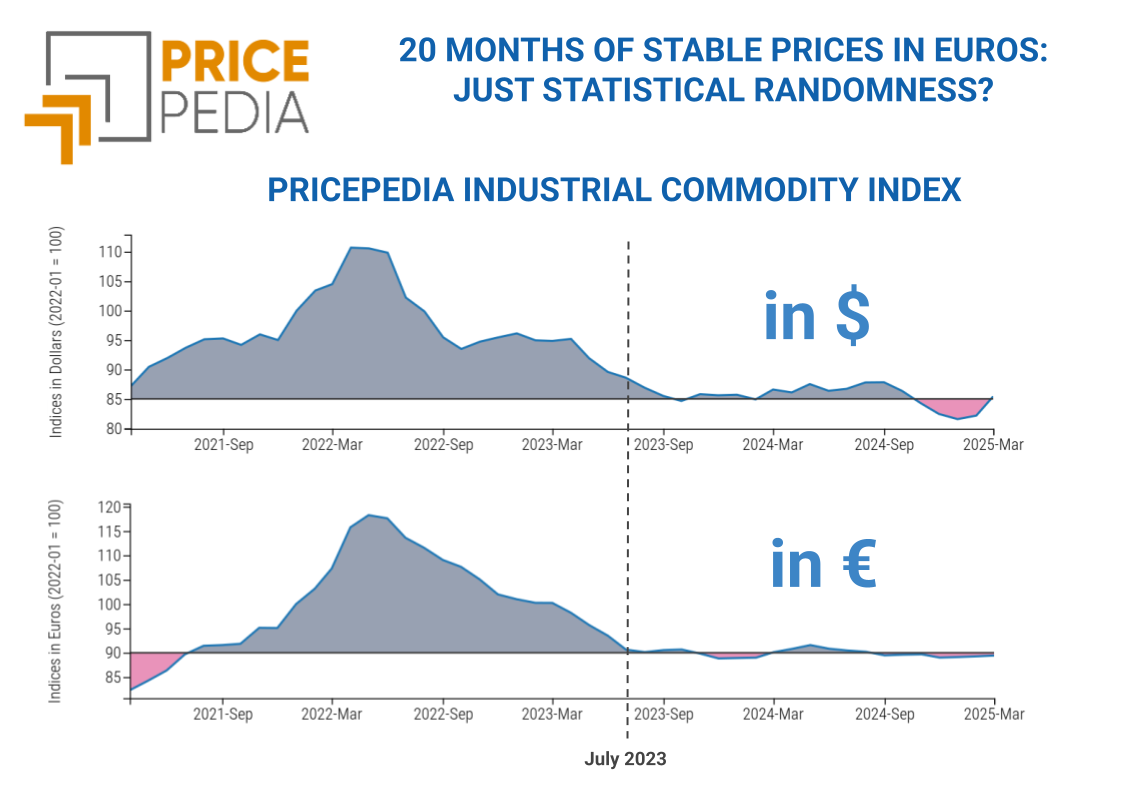
The industrial commodity aggregate includes all commodities except energy, food, and precious metals. It gathers all those commodities - from metals to wood and paper, from chemicals to textile fibers - that serve as inputs in industrial processes and whose supply and demand are primarily driven by industrial decisions, with relatively limited influence from factors such as weather or geopolitics.
Do you want to stay up-to-date on commodity market trends?
Sign up for PricePedia newsletter: it's free!
Naturally, beneath this apparent stability, prices of different commodity families have fluctuated with varying intensities over the past 20 months (see the graph below), leading to the hypothesis that the stability observed in the aggregate may be the result of statistical randomness. However, a 20-month sequence with price changes consistently ranging between -1% and +1% inevitably raises the question of whether counterbalancing forces are at play, generating this exceptional stability.
This question is crucial because if the stability is merely a statistical outcome, there is no reason to assume it will persist in the future. On the other hand, if it results from opposing forces that may continue to operate, then the hypothesis of ongoing stability becomes more plausible.
Graph 3: March 2025, percentage variations in euros compared to July 2023
Source: PricePedia
The analytical hypothesis we believe is worth exploring is that this phenomenon is the result of a paradox: European industry is experiencing such a high level of uncertainty that most companies are simply repeating past decisions without any changes. This behavior leads to high predictability in both supply and demand conditions in commodity markets, resulting in stable prices.
If this hypothesis is correct, significant changes are on the horizon: the trade war initiated by the Trump administration, Europe's need to define its own security strategy, and Germany's unprecedented investment plan.
Faced with these transformations, European companies will inevitably have to adapt to new and unexplored scenarios.
1. The PricePedia Commodity index is the aggregation of Industrials, Food and Energy indices.
2. The PricePedia Industrials index is the aggregation of indices related to the following categories: Ferrous Metals, Non-Ferrous Metals, Wood and Paper, Pharmaceutical Chemicals, Chemicals: Specialty, Organic Chemicals, Inorganic Chemicals, Plastics and Elastomers, and Textile Fibers.
