Benzene: A Global Price for a Strategic Supply Chain
From Global Benchmark Formation to Cost Dynamics and Price Transmission Across Derivatives
Published by Luigi Bidoia. .
Organic Chemicals Cost pass-throughFollowing the analysis of ethylene (Ethylene: Price Dynamics and Competitive Advantages between the United States and Europe) and propylene (Cost Pass-Through along the Supply Chain of Propylene Intermediates), this article focuses on benzene, another key building block of the petrochemical industry.
Unlike ethylene and propylene, the transportation cost of benzene is relatively low. With an estimated global production of around 100 million tonnes, international trade in benzene amounts to about 12 million tonnes. This means that 12% of the benzene produced is traded internationally, compared to 7% for both ethylene and propylene.
The table below presents key data for the three building blocks, allowing for a direct comparison of their average logistics costs.
Comparison of Transportation and Storage Costs
| Factor | Ethylene | Propylene | Benzene |
| State at room temperature | Gas | Gas | Liquid |
| Transport requirements | Cryogenic (–104 °C) or high pressure + inert atmosphere | Refrigerated or compressed | Standard, liquid tank |
| Type of vessel/tank | Specialized cryogenic | Pressurized or refrigerated | Standard chemical liquid tank |
| Easy to store? | Difficult | Complex | Easy |
| Relative transport cost (€/ton per 5,000 km) | 300-500 | 200-300 | 80-120 |
| Average market price per ton in the EU (2010–2024, €) | 971 | 937 | 800 |
| Transport cost incidence | Over 40% | 25%-30% | Below 15% |
A single worldwide price
Lower transportation costs, both over short and long distances, combined with a high volume of trade, have contributed to the emergence of a global benzene market, characterized by the formation of a single worldwide price. The export price from South Korea to China — which accounts for over 20% of global benzene trade — tends to serve as a benchmark for setting this global price.
The following chart compares the CIF price of benzene imported by China (with more than half coming from South Korea) with the CIF price of U.S. imports and the customs prices of European Union trade.
Comparison of benzene prices in different areas of the world

The chart analysis highlights a strong alignment among the three price series. The CIF prices of Chinese and U.S. imports are nearly overlapping. EU customs prices also show a close correlation, confirming the presence of market mechanisms that tend to align intra-EU trade prices with the global benzene price. However, this alignment is not always immediate, indicating that there may be short periods during which EU prices diverge from the global benchmark, before market forces bring them back into alignment.
Dynamics of Benzene Production Costs
The alignment of regional benzene prices with the global benchmark is particularly relevant considering that benzene can be produced through two different industrial processes, each with potentially very different production costs:
- through catalytic reforming of virgin naphtha;
- through fractional distillation of coal tar.
Since the price of virgin naphtha (which closely tracks oil prices) follows a very different trend from that of coal tar (which is linked to coal prices), the ratio between the production costs of benzene from naphtha and from coal tar tends to vary significantly over time. However, this variability in relative production costs does not result in a divergence in the market prices of benzene produced by the two processes (as shown in the chart below), but rather in significant changes in profit margins.
Price comparison of benzene produced by different processes

Benzene Price Cost Pass-Through
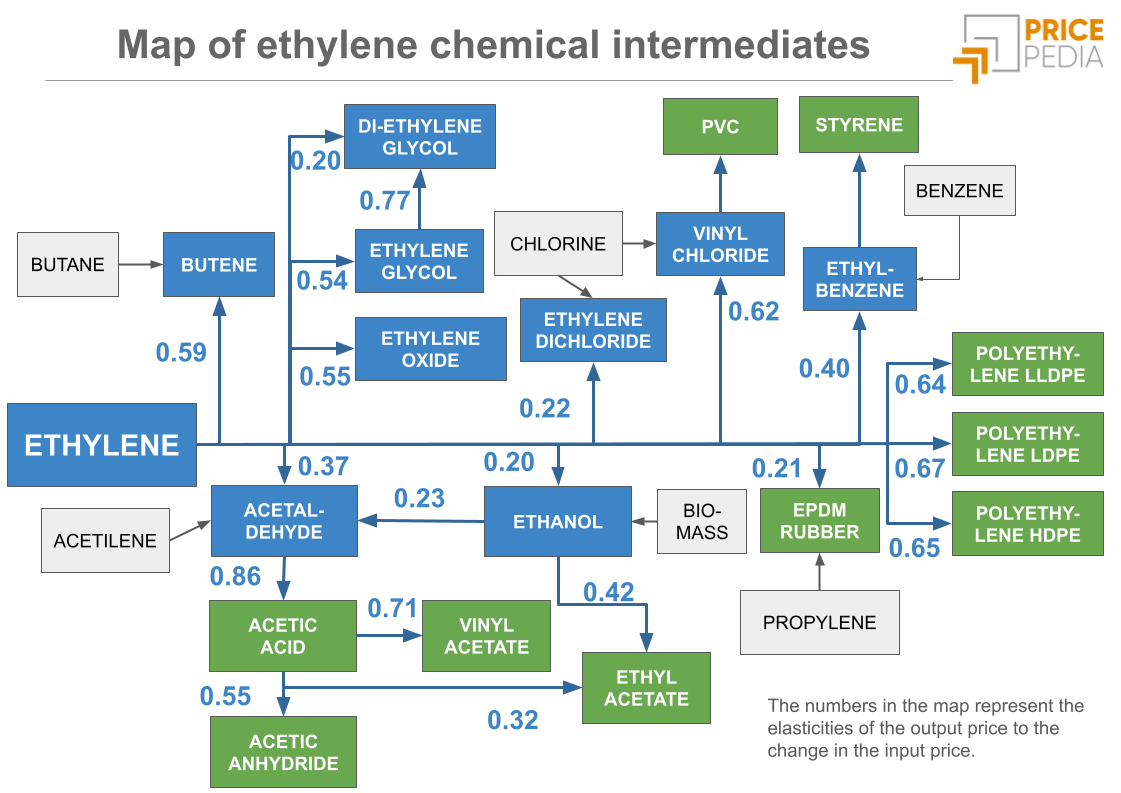
As previously analyzed for ethylene and propylene, the following map shows the production relationships between benzene and its main derivatives. This is a simplified representation, as many of the chemical products shown can be synthesized through multiple alternative processes. Nevertheless, the relationships illustrated can be considered predominant within the European chemical industry.

The map highlights the key chemical compounds produced using benzene and the elasticity of their prices in response to changes in the benzene price. Among the compounds with the highest price elasticity are cyclohexane and ethylbenzene. On the other hand, aniline and, especially, chlorobenzene show relatively low price elasticity with respect to benzene price fluctuations.
Conclusions
Benzene plays a fundamental role as a chemical intermediate. Given the existence of production plants using different processes based on two distinct raw materials (virgin naphtha and coal tar), production costs can vary significantly over time across facilities. Despite these differences, benzene prices tend to converge in each period toward a single global price, regardless of the production process or regional market.
Changes in the global benzene price are transmitted throughout the various production chains, influencing the pricing of many intermediate chemical products (from cumene to ethylbenzene, from chlorobenzene to aniline, from caprolactam to xylenes) and extending to a wide range of plastics and resins (from PET to styrene, from polyamides to epoxy and alkyd resins).
Analyzing and monitoring these value chains enables anticipation of downstream price changes based on developments observed in benzene and upstream inputs.
You may be interested in:

From raw materials to markets: how prices are formed in basic petrochemicals
Published by Luigi Bidoia. .
Organic Chemicals Petrolchimica Price DriversNafta, gas naturale e catrame: tre percorsi che convergono nei grandi mercati degli idrocarburi alcheni e aromatici. [ Read all ]

China Takes the Lead in Organic Chemistry: A New Landscape for European Sourcing
Published by Luigi Bidoia. .
Organic Chemicals Price DriversL’industria chimica cinese cambia le regole del gioco: i buyer europei non possono più ignorarla [ Read all ]
Ethylene: Price Dynamics and Competitive Advantage Between the US and Europe
Published by Luigi Bidoia. .
Organic Chemicals Cost pass-throughCome le variazioni del prezzo dell'etilene si trasferiscono sui prezzi dei derivati [ Read all ]