PricePedia Scenario for April 2025
How commodity price forecasts change after the US tariff announcement
Published by Pasquale Marzano. .
Forecast Forecast
The PricePedia Scenario has been updated with information available as of April 4, 2025. As described in the article Liberation or Ruination Day? A storm of tariffs on commodity markets, the introduction of US tariffs has shaken not only the financial commodity markets but also broader economic expectations. One of the most significant effects of the American measures has been the increased downside risk to the global economic outlook.
This risk will be greater if US trade decisions lead to retaliatory actions from partner countries. In this regard, China’s response was swift: it announced the introduction of a reciprocal tariff on imports from the United States, matching the 34% rate that the White House will apply to Chinese imports starting April 9.
In the coming days, a response from the European Union is also expected. Although the EU has expressed openness to dialogue, it has also stated its readiness to implement countermeasures.
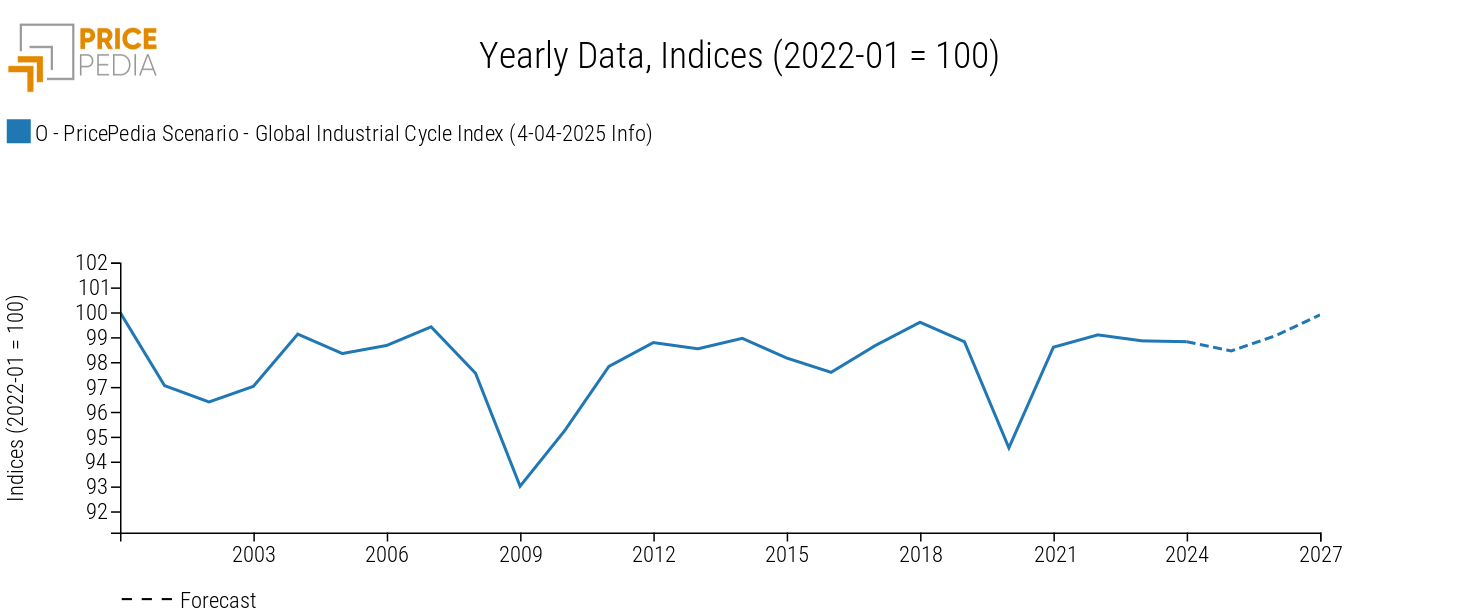
The increase in downside risks is evident, for example, in global industrial production - an indicator of global demand for manufactured goods - whose growth is projected to slow over the next two years compared to the previously published scenario[1].
The graph below shows the trend of the global industrial cycle index[2], which reflects industrial production performance.
Global Industrial Cycle, April 2025 Scenario

Based on currently available information, it is estimated that, on an annual basis, the global industrial cycle may register a decline of -0.4% in 2025, a deterioration compared to the March scenario. For 2026, however, moderate growth of nearly 1% is still expected.
Do you want to stay up-to-date on commodity market trends?
Sign up for PricePedia newsletter: it's free!
Forecast for procurement material prices
The increased downside risks to global commodity demand also worsen the price outlook for raw materials. In the case of the latter, all else being equal, this occurs not only due to reduced demand but also due to increased availability of commodities resulting from reduced exports to the United States, which boosts supply on international markets (see the article Effects of US tariffs on global commodity prices).
The following table shows the annual price changes in euros for the main commodity groups (Industrials[3], Commodity[4], Energy, and Food).
Table 1: Annual Variation Rates (%) of PricePedia Aggregate Indices, in Euro
| 2023 | 2024 | 2025f | 2026f | |
|---|---|---|---|---|
| I-PricePedia Scenario-Commodity Index (Europe) (4-04-2025 Info) | -18.21 | -4.50 | -5.53 | -2.69 |
| I-PricePedia Scenario-Industrials Index (Europe) (4-04-2025 Info) | -13.85 | -4.41 | -1.03 | -0.09 |
| I-PricePedia Scenario-Energy Total Index (Europe) (4-04-2025 Info) | -23.88 | -5.89 | -13.32 | -5.19 |
| I-PricePedia Scenario-Food Total Index (Europe) (4-04-2025 Info) | -5.47 | +2.99 | +12.50 | -3.48 |
Following a -4.5% annual decline in 2024, the downward trend in euro commodity prices is expected to intensify, with a -5.5% drop in 2025. The decline is set to continue into 2026, bringing prices to levels -2.7% lower than the previous year.
Among the main commodity aggregates, the sharpest drop in 2025 is expected for energy raw materials, due to a worsening outlook for major products, especially oil prices. In addition to the general economic context, another factor influencing this forecast was the decision by OPEC+ producers to increase crude oil production at a time when future consumption prospects have deteriorated. As a result, the $80 per barrel threshold has effectively been abandoned as a reference price for Brent.
The deterioration of the global economic outlook also implies a decline in industrial commodity prices in 2025, by -1% (previously +0.9%). In 2026, euro prices are expected to remain broadly stable.
As for food commodity prices, after a projected increase in the average for 2025 - already largely realized in the first few months of the year - a -3.5% decrease is expected in 2026.
1. See PricePedia Scenario for March 2025.
2. The global industrial cycle index is constructed by purifying the actual dynamics of industrial production from its trend. Since the supply of commodities tends to vary according to long-term economic growth expectations, while the demand for commodities is more linked to actual cyclical uses, the global industrial cycle index tends to reproduce the conditions of tension between demand and supply on the commodity market: when it increases, it means that the demand for commodities increases more than the supply; vice versa when it decreases.
3. The PricePedia Industrials index results from the aggregation of the indices relating to the following product categories: Ferrous, Non-Ferrous, Wood and Paper, Chemicals: Specialty, Organic Chemicals, Inorganic Chemicals, Plastics and Elastomers and Textile Fibres.
4. The PricePedia Commodity index results from the aggregation of the indices relating to industrial, food and energy commodities.


