Transfer of US-China tensions from trade to financial flows
Markets under stress: how Trump's tariffs affect financial price fluctuations
Published by Luca Sazzini. .
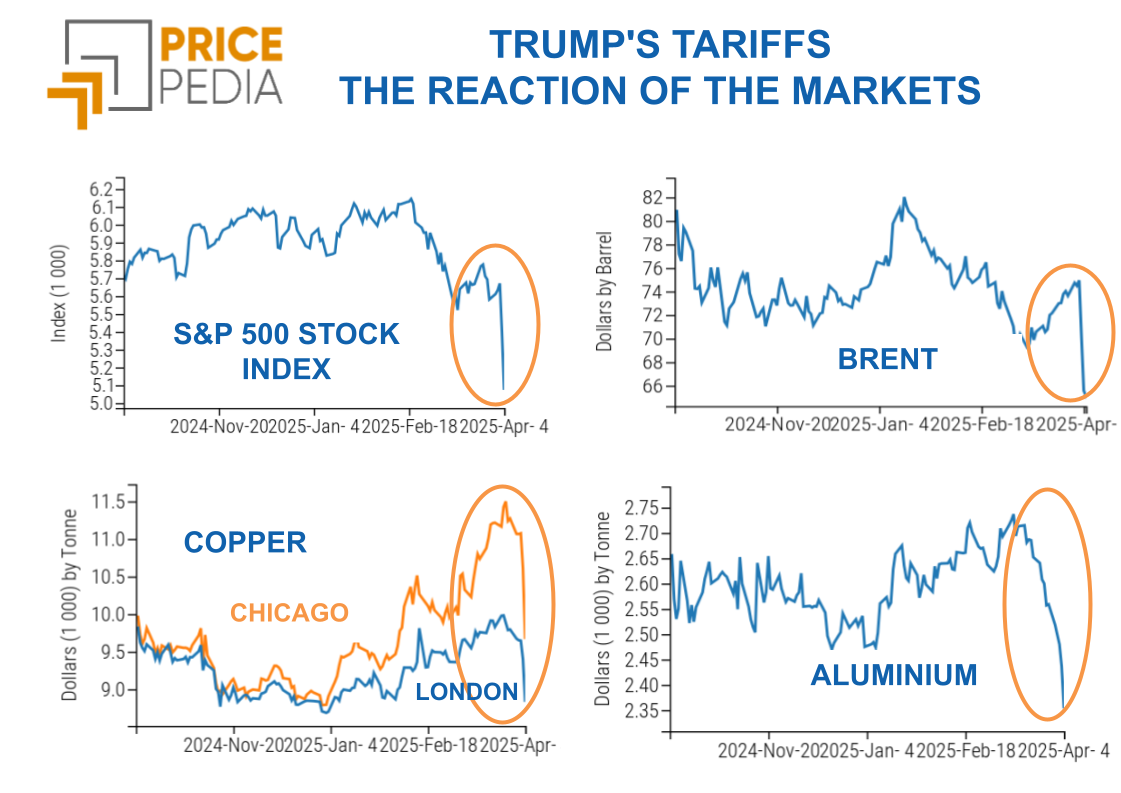
Conjunctural Indicators Commodities Financial WeekThe unpredictability of President Trump's announcements continues to destabilize financial markets, which experience sharp turbulence with every new statement on tariffs.
On Tuesday, April 8, President Trump announced a 90-day suspension of the reciprocal tariffs announced last week, during what he called 'Liberation Day'. The only country for which the application of tariffs was not suspended—in fact, where there was a strong escalation during the week—was China. Unlike other countries affected by US tariffs, China did not seek to negotiate but responded by imposing counter-tariffs similar to those imposed by Trump, declaring it would not yield to ‘unilateral blackmail’ and asserting its determination to fight to the end. As a result, the trade dispute worsened further: US tariffs on Chinese imports reached 145%, while those imposed by China on US products rose to 125%.
To further pressure the US presidency, the Chinese government—which is the largest holder of US public debt—appears to have started selling part of its reserve of Treasuries (bonds issued by the US government).
Since its accession to the WTO (December 11, 2001), China has accumulated a significant trade surplus with the United States, reinvesting those surpluses in US government bonds and Wall Street-listed assets. This dynamic generated a dual benefit: the United States could enjoy low-cost goods and finance its debt, while China benefited from greater demand for its exports and was able to use Treasuries to expand its reserves and contribute to the stabilization of the yuan. However, with the introduction of tariffs by President Trump, aimed at reducing the US trade deficit, Chinese exports will no longer have easy access to the American market. In response, China seems to have embarked on a retaliatory strategy by selling US bonds, with proceeds potentially reinvested in other safe havens such as German Bunds or gold, whose demand from China continued to grow over the past year despite prices reaching new all-time highs.
The effects on financial markets have been evident: not only on the performance of US government bonds, but also on the dollar and the price of gold.
The following chart shows the US dollar exchange rate, the spread between US Treasuries and German Bunds, and the trend in the price of gold.
Euro trends chart of the $ exchange rate, the Treasury vs Bund spread, and CME gold prices

The chart analysis highlights the following points:
- A depreciation of the US dollar, triggered by the sale of US government bonds by the Chinese government. Yesterday, it took 1.13 dollars to buy one euro.
- A sharp increase in the spread between US Treasuries and German Bunds, driven primarily by Chinese sales of US bonds and, to some extent, by increased demand for German bonds by investors. Despite the rise in German public debt, financial markets view Bunds—along with Swiss bonds—as the current best defensive choice. Yesterday, demand for 10-year German Bunds was so high that their yield dropped to 2.53%; conversely, the low demand for Treasuries pushed their yield up to 4.49%.
- A new rise in gold prices, the ultimate safe haven asset. After the drop following last week's US tariff announcement, gold rebounded starting Tuesday, when Beijing declared it was ready to "fight to the end" against the United States.
Meanwhile, stock markets saw a strong rebound on Wednesday due to the announcement of a 90-day suspension of reciprocal US tariffs. The following chart shows the highly erratic trend of the S&P 500, the benchmark index of the US stock market.
Historical series of the S&P 500

Following last week's price crash, the US stock index rebounded nearly 10% on Thursday alone, driven by the announcement of the suspension of reciprocal US tariffs. However, it then lost nearly 4% on Thursday and slightly recovered yesterday. The market remains in a phase of extreme volatility, closely tied to US trade policy decisions.
Weekly summary of commodity financial prices
At the beginning of the week, commodity financial markets continued the price decline triggered by last week's US tariff announcement. Only in recent days has there been a partial recovery, encouraged by the temporary suspension of reciprocal tariffs by Washington and the weakening of the US dollar.
Prices of energy commodities showed mixed fluctuations during the week, but overall, both crude oil and, above all, Dutch TTF natural gas prices declined. After a slight recovery on Wednesday—supported by President Trump's announcement and the depreciation of the US dollar—crude oil prices fell again due to increasing inventory data and growing concerns over a possible slowdown in Chinese demand.
The decline in Dutch TTF natural gas was even more pronounced, driven by mild temperatures and massive sell-offs by investment funds.
In the industrial metals sector, copper remains particularly sensitive to trade-related news, especially the price quoted on the Chicago Mercantile Exchange. The chart below compares copper prices quoted in Chicago and those traded on the London Metal Exchange.
Spread between London and Chicago copper prices, expressed in $ per ton

The chart shows a significant reduction in the spread between the two markets starting April 2, the date of the US tariff announcement, which did not include copper among the taxed goods. This led to a convergence in quotations, although CME prices remain relatively higher. Supporting this differential are President Trump’s repeated threats to impose future tariffs on the red metal.
Overall, however, the general trend for industrial metals—both ferrous and non-ferrous—remains predominantly bearish, despite the partial recovery toward the end of the week.
NUMERICAL APPENDIX
ENERGY
Despite sharp weekly fluctuations, the PricePedia index of energy products signals a general decline in prices.
PricePedia Financial Index of energy prices in dollars

The PricePedia energy heatmap is shaded green, indicating a double-digit weekly decline in the 3-day moving averages of oil and European natural gas prices.
HeatMap of energy prices in euro

PLASTICS
The financial index of Chinese plastics and elastomers shows a marked downward trend, with a slight upward fluctuation on Thursday.
PricePedia Financial Indices of plastic prices in dollars

The heatmap analysis shows a weekly decline in prices, more pronounced for elastomers than for thermoplastics.
HeatMap of plastic and elastomer prices in euro

FERROUS METALS
After a drop at the beginning of the week, the two indices of ferrous metals partially recover, supported by the postponement of mutual US tariffs and the depreciation of the dollar.
PricePedia Financial Indices of ferrous metal prices in dollars

The heatmap analysis shows a sharp price drop for Chinese iron ores, stainless coils, and steel rebar.
HeatMap of ferrous metal prices in euro

Do you want to stay up-to-date on commodity market trends?
Sign up for PricePedia newsletter: it's free!
INDUSTRIAL NON-FERROUS METALS
The financial indices of non-ferrous metals show even sharper fluctuations than those in the ferrous market. After the collapse in the first few days, a partial recovery starts from Thursday.
PricePedia Financial Indices of industrial non-ferrous metal prices in dollars

The non-ferrous heatmap clearly shows the weekly decline of the moving average of non-ferrous prices, especially for tin, which had recorded the largest increase since the beginning of the year.
HeatMap of non-ferrous metal prices in euro

FOOD COMMODITIES
The index of edible oils and, especially, that of cereals show a price increase, while the index of tropicals shows opposite-signed fluctuations.
PricePedia Financial Indices of food commodity prices in dollars

CEREALS
The cereals heatmap shows a price drop for oats and a price increase for corn and soybean meal.
HeatMap of cereal prices in euro

TROPICALS
The heatmap of tropicals shows very marked contractions in the moving averages of coffee and cocoa prices.
HeatMap of tropical food prices in euro

OILS
The heatmap of edible oils shows a weekly moving average price drop for palm oil, alongside an increase in canola oil prices.
HeatMap of edible oil prices in euro

You may be interested in:
Liberation or Ruination Day? A storm of tariffs on commodity markets
Published by Luca Sazzini. .
Conjunctural Indicators Commodities Financial WeekFinancial markets fail U.S. protectionist policy [ Read all ]

Commodities in check since Trump's annnucials
Published by Luca Sazzini. .
Conjunctural Indicators Commodities Financial WeekFaced with uncertainty, investors find refuge in gold [ Read all ]
Shock in energy markets over tensions between U.S. and Iran
Published by Luca Sazzini. .
Conjunctural Indicators Commodities Financial WeekGrowth in energy prices is associated with growth in nonferrous metals [ Read all ]