From Liberation to Rollback Day: how markets forced a break on Trump
Market reaction curbs Trump's tariff assault, but uncertainty remains very high
Published by Luca Sazzini. .
USA customs duties Commodities Financial WeekThis week, financial markets remained on hold awaiting new signals from the Trump administration, after the negative reaction following the announcement of the so-called Liberation Day on April 2 forced the White House to temporarily backtrack. On April 9, in fact, President Trump announced a 90-day suspension for many of the tariffs introduced, marking a moment of partial withdrawal that some commentators have dubbed Rollback Day.
In a macroeconomic context marked by high uncertainty, President Trump continues, however, to alternate conflicting statements on trade policy, contributing to increased financial market volatility.
After the 90-day suspension of reciprocal tariffs and the temporary exemption granted to certain consumer electronics — including products from China — the line of U.S. trade policy has made no progress toward easing tensions. During the week, President Trump:
- scaled down the scope of the tariff exemption for electronic goods and announced new tariff measures for the technology sector;
- rejected the European Union's proposal for the reciprocal elimination of tariffs on industrial goods;
- further intensified trade tensions with China.
This last point is driving uncertainty in the financial markets, as tensions with China seem to have reached the levels of a full-blown trade war.
U.S. tariffs on some Chinese products have reached total rates of 245%, and President Trump has declared his intention to exclude China from global trade, promising tariff concessions to countries that align with the United States. These statements have fueled demand for safe-haven assets, pushing the price of gold — on Wednesday — up by over 3%, surpassing the symbolic threshold of $3,300/ounce.
The following chart shows the trend of gold prices quoted on the Chicago Mercantile Exchange, expressed in dollars per troy ounce.
CME Financial Gold Prices, in $/troy ounce

The analysis of the chart highlights a strong increase in gold prices, especially over the past two weeks.
The uncertainty of U.S. trade policy, combined with dollar weakness, has led many investors — particularly in China — to increase demand for gold as a safe-haven asset. It is also hypothesized that the rise is linked to an increase in imports by the People's Bank of China, which may have converted part of its Treasury reserves into gold.[1]
Except for a 2% decline recorded on Wednesday by the S&P 500 index, due to the escalation of trade tensions between the United States and China, the U.S. stock market remained relatively stable during the week. The exchange rate between the U.S. dollar and the euro also remained virtually unchanged from the previous week.
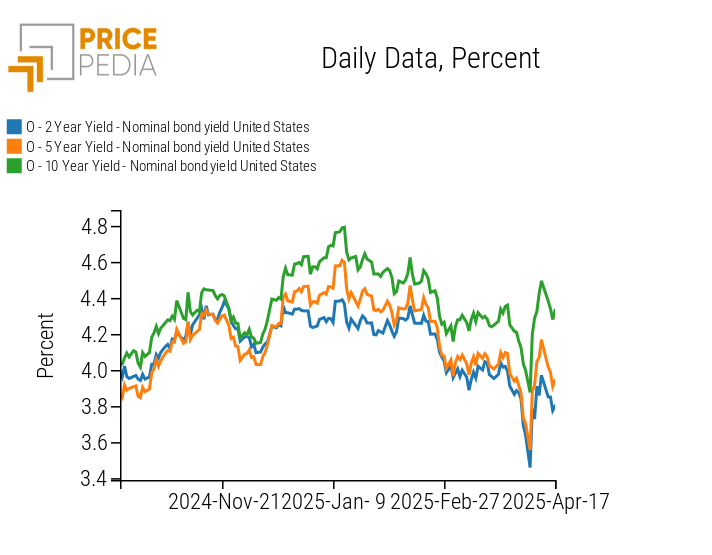
However, significant differences are observed in the U.S. Treasury market, which experienced a rebound in yields compared to last week's levels. The following chart illustrates the trend in yields of U.S. government bonds with 2, 5, and 10-year maturities.
Treasury Yields with 2, 5, and 10-Year Maturities
Weekly Summary of Commodity Financial Prices
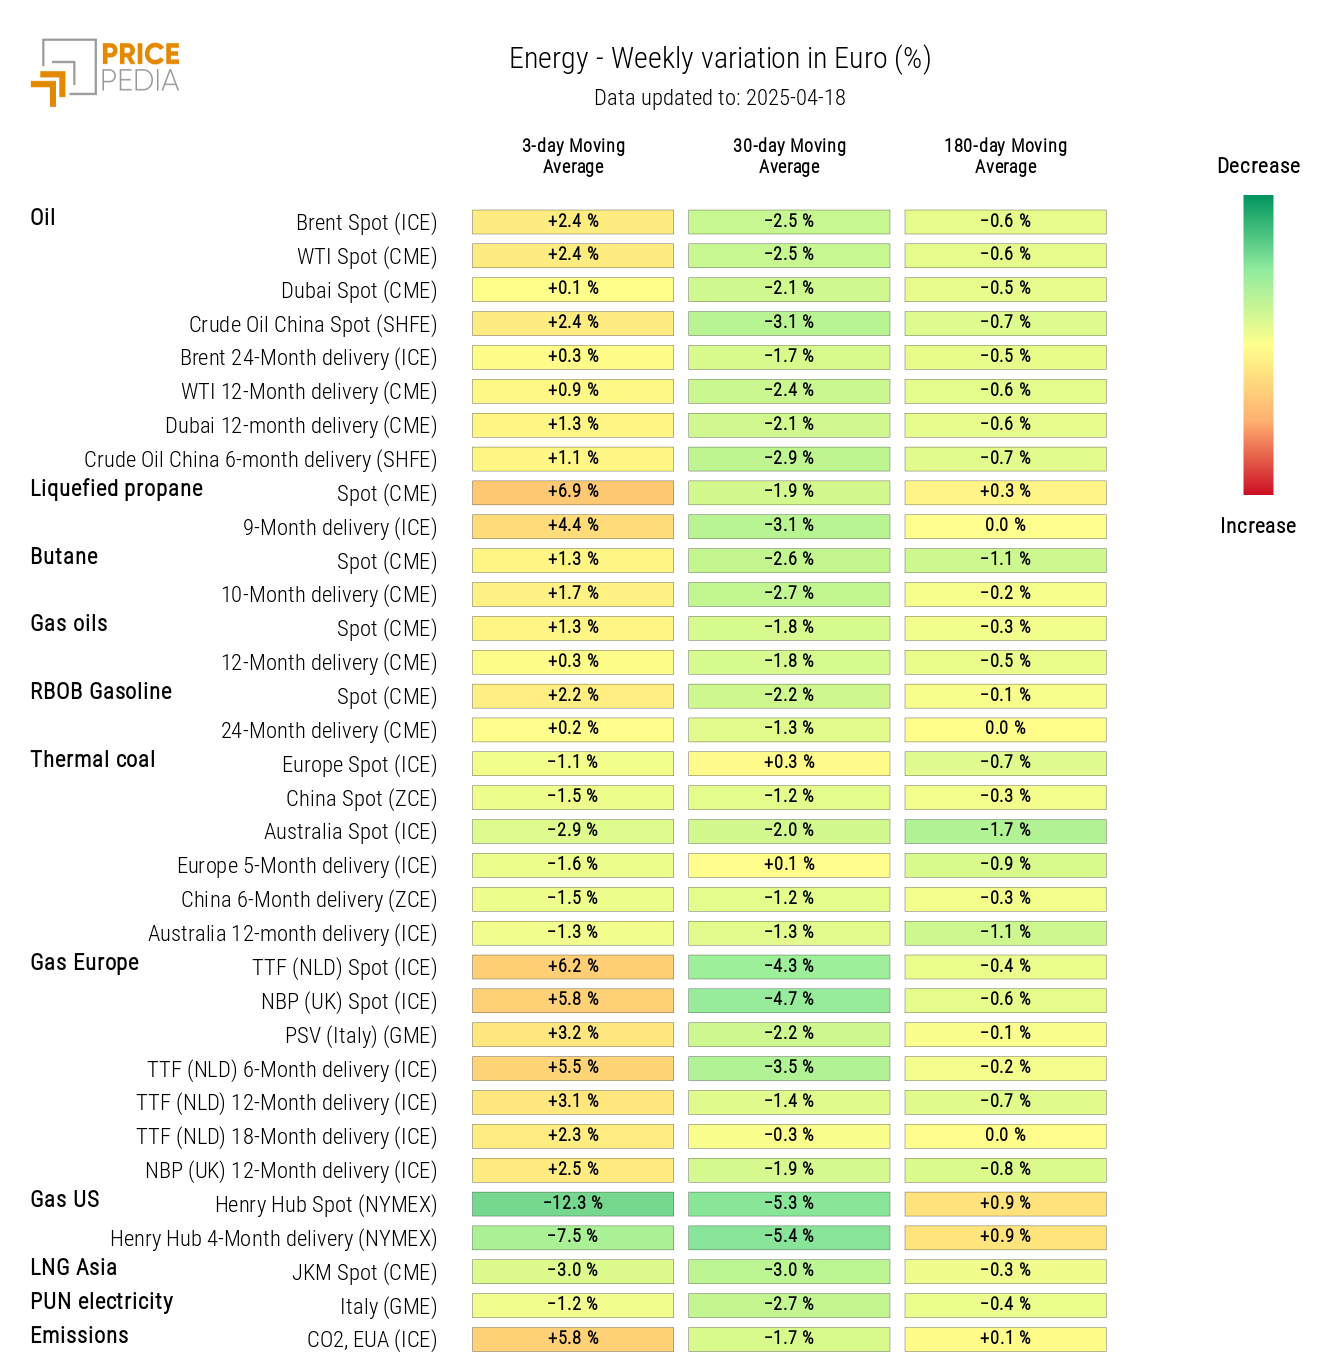
After two weeks of decline, the price of oil is rising again, driven by new sanctions imposed by the United States to limit Iranian exports, which have reignited concerns over global supply. Washington targeted a Chinese refinery involved in trade with Tehran and sanctioned several Chinese ships accused of transporting Iranian crude oil. Adding to these tensions are recent statements from Iraq, Kazakhstan, and other OPEC+ members, expressing their intention to further reduce production. The combined effect has fueled concerns on the supply side, contributing to the increase in oil prices from Wednesday.
The price of TTF Dutch natural gas also recorded an increase during the week, unlike the U.S. gas price, which continues its downward trend.
In the industrial metals market, there was a slight decline in ferrous metal prices, more pronounced on Chinese exchanges than on European ones.
Prices of non-ferrous metals remained relatively similar to last week's levels. After a slight rise on Monday, prices experienced some declines influenced by new preliminary trade data indicating a reduction in Chinese imports. Also in this case, prices quoted on the Shanghai market recorded larger declines than those on the London market, increasing the price spread between the two markets.
Monetary Policy
The European Central Bank has cut interest rates by 25 basis points, in line with analysts' expectations. The decision was unanimous and is justified by the slowdown in growth expectations, linked to new trade tensions.
The data released this week on the Consumer Price Index (CPI) indicate an inflation increase in March of 2.2% y/y. This dynamic is in line with forecasts and considered compatible with the gradual return to the 2% target.
In light of the potential negative effects of U.S. protectionist measures on the eurozone economy, markets have begun to price in further rate cuts by the end of the year, with levels potentially falling below 2%.
Meanwhile, across the Atlantic, expectations regarding future monetary policy appear significantly more uncertain. The chairman of the Federal Reserve (FED), Jerome Powell, does not seem inclined to reduce interest rates, although he acknowledges that the uncertainty generated by Donald Trump’s tariff policies could have lasting effects on the economy. Currently, the FED’s priority is to keep inflation under control, and Powell has stated that he does not foresee any imminent changes to interest rate policy.
President Donald Trump has harshly criticized Powell, even threatening him with potential dismissal. However, he does not have the authority to do so, as the Federal Reserve is an institution independent from the executive branch.
[1] For further details, refer to last week's article: Transfer of US-China tensions from trade to financial flows
NUMERICAL APPENDIX
ENERGY
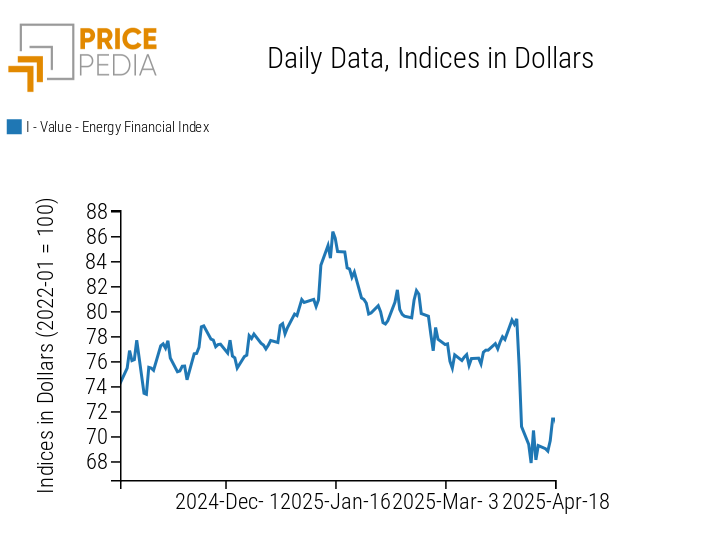
The PricePedia financial index of energy products shows a price recovery due to U.S. sanctions aimed at reducing Iranian oil exports.
PricePedia Financial Index of Energy Prices in Dollars
The PricePedia energy heatmap shows a recovery in oil and European natural gas prices, alongside a decline in U.S. natural gas prices.
HeatMap of Energy Prices in Euro
PLASTICS
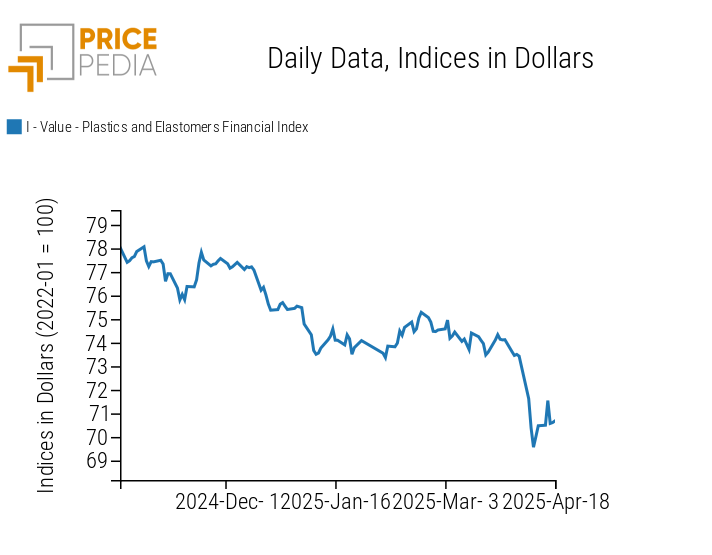
The financial index of plastics and elastomers follows a weekly oscillation that does not significantly affect price levels, after the recovery recorded in the final days of last week.
PricePedia Financial Index of Plastics Prices in Dollars
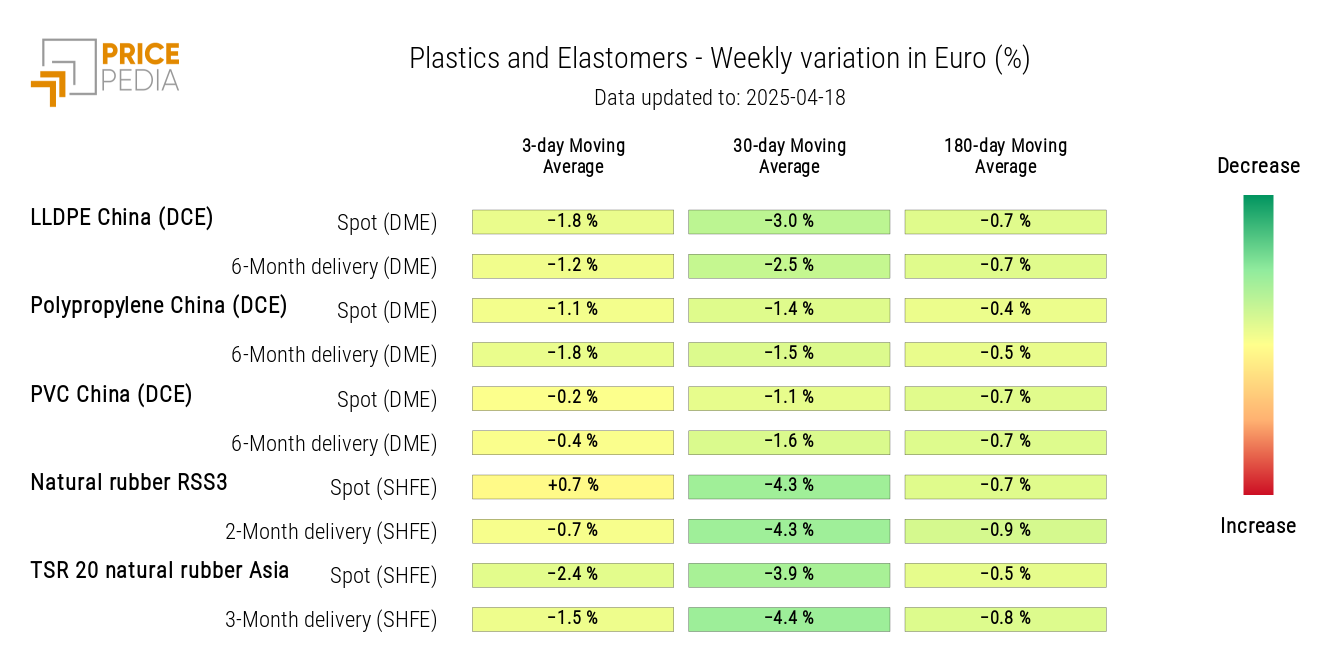
Weekly changes in the 3-day moving averages of plastics and elastomers prices remain negative, though contractions are notably smaller than those seen in the 30-day moving average.
HeatMap of Plastics and Elastomers Prices in Euro
FERROUS METALS
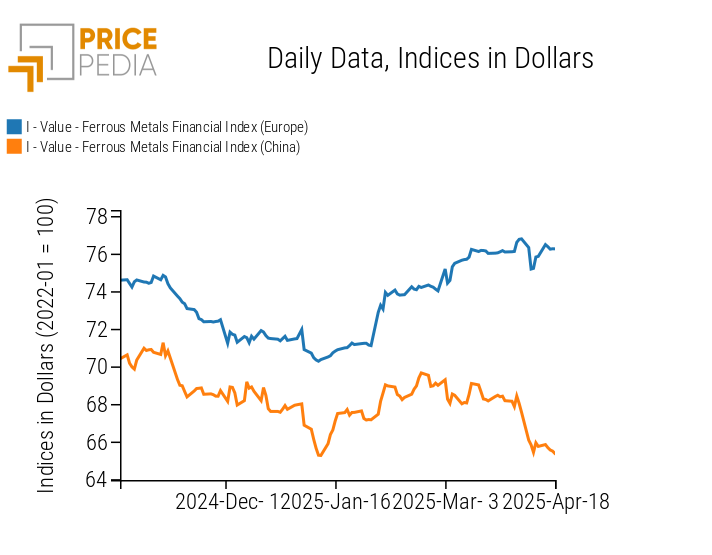
The two ferrous metals indices continue to diverge, with the Chinese index showing larger price declines.
PricePedia Financial Index of Ferrous Metals Prices in Dollars
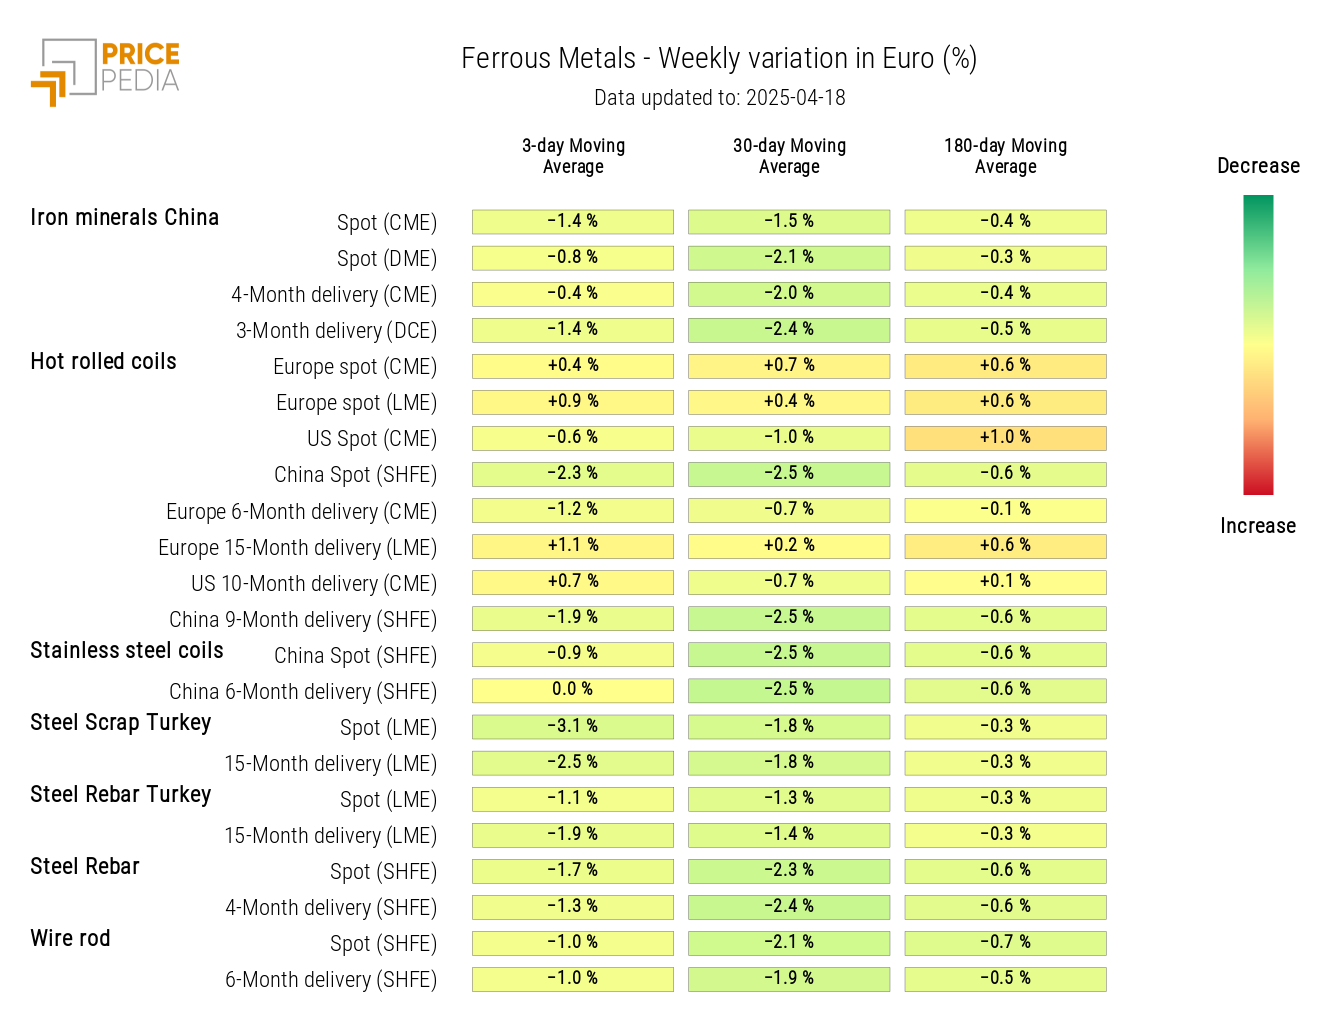
The ferrous metals heatmap shows a weekly decline in the 3-day moving average of prices for Turkish steel scrap, hot-rolled coils quoted in Shanghai, and Chinese iron ore.
HeatMap of Ferrous Prices in Euro
Do you want to stay up-to-date on commodity market trends?
Sign up for PricePedia newsletter: it's free!
NON-FERROUS INDUSTRIAL METALS
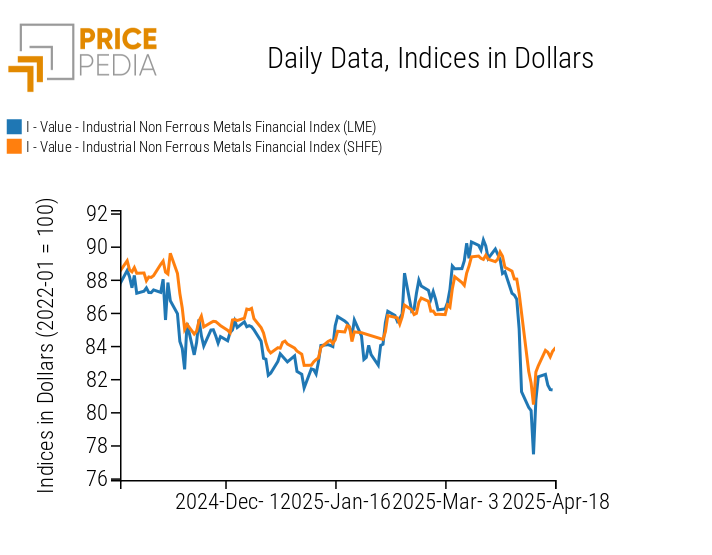
After the recovery in the final days of last week following the 90-day suspension of “reciprocal” tariffs, the financial indices of non-ferrous metals followed a slightly upward price trend this week.
PricePedia Financial Index of Non-Ferrous Industrial Metals Prices in Dollars
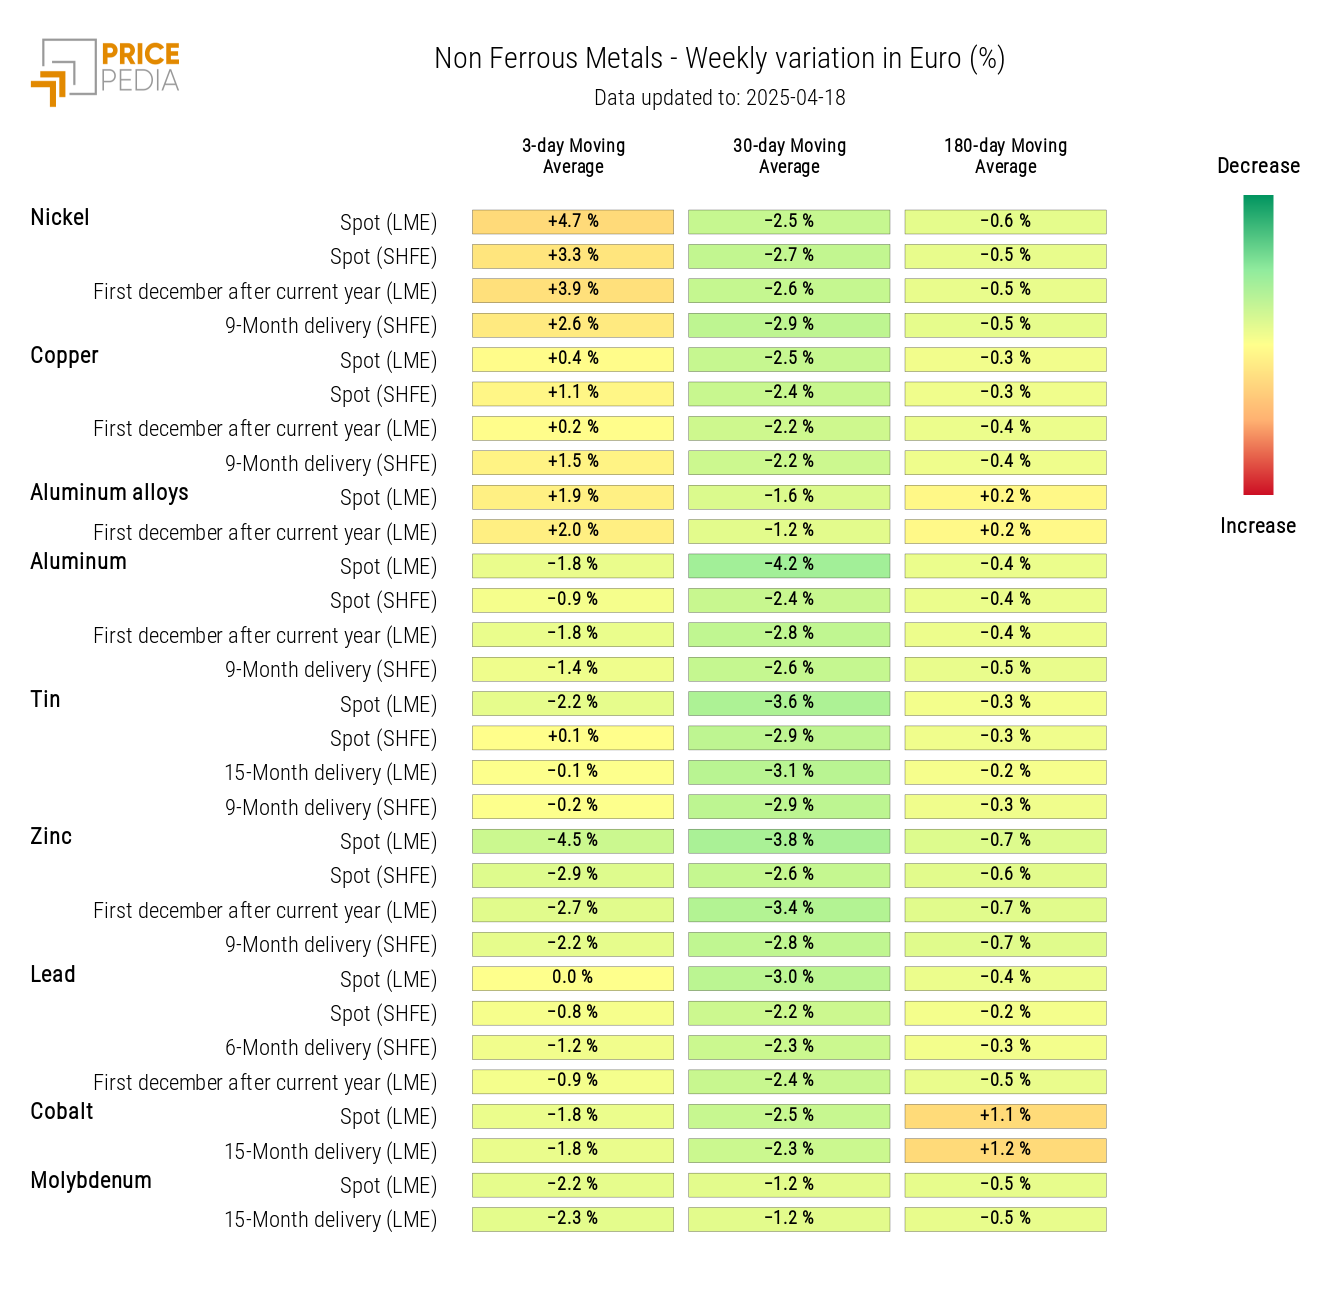
The non-ferrous heatmap highlights an increase in nickel prices, alongside a decline in zinc prices.
HeatMap of Non-Ferrous Prices in Euro
FOOD PRODUCTS
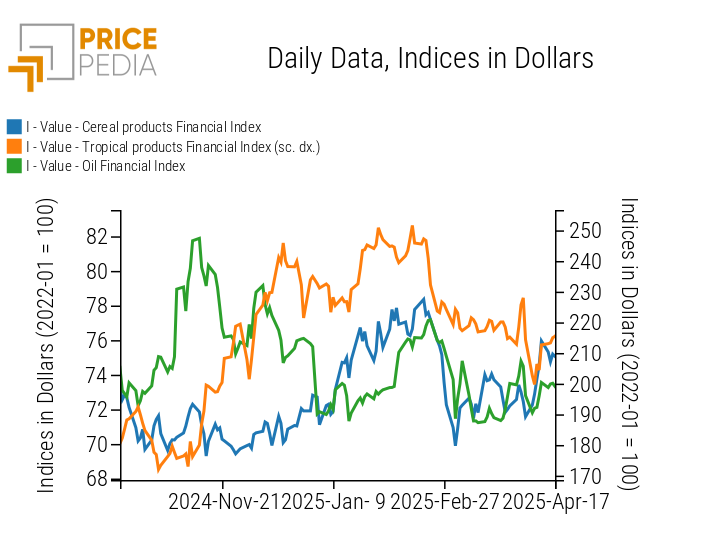
The indices for cereals and oils show price fluctuations without a clear direction. In contrast, the trend for tropical products is more clearly upward.
PricePedia Financial Index of Food Prices in Dollars
CEREALS
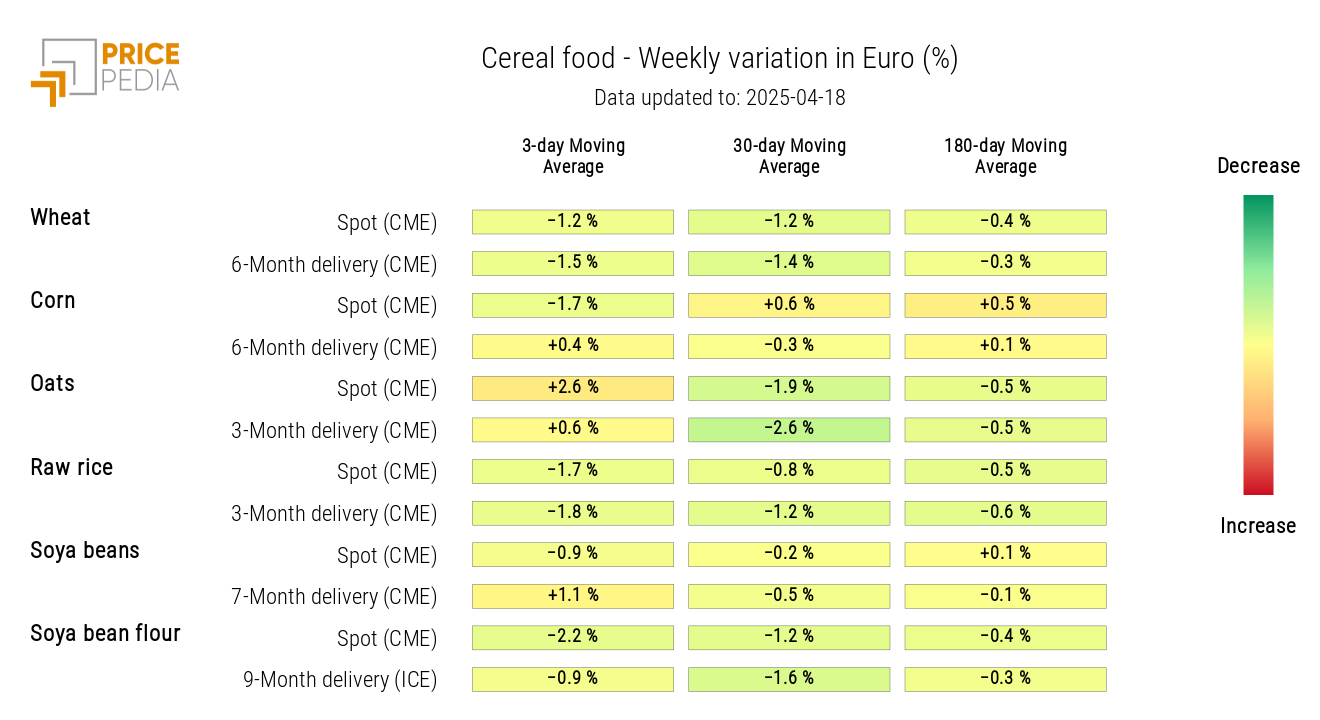
The cereals heatmap shows a recovery in oat prices and a decline in spot prices for corn, rough rice, wheat, and soybean meal.
HeatMap of Cereal Prices in Euro
TROPICALS
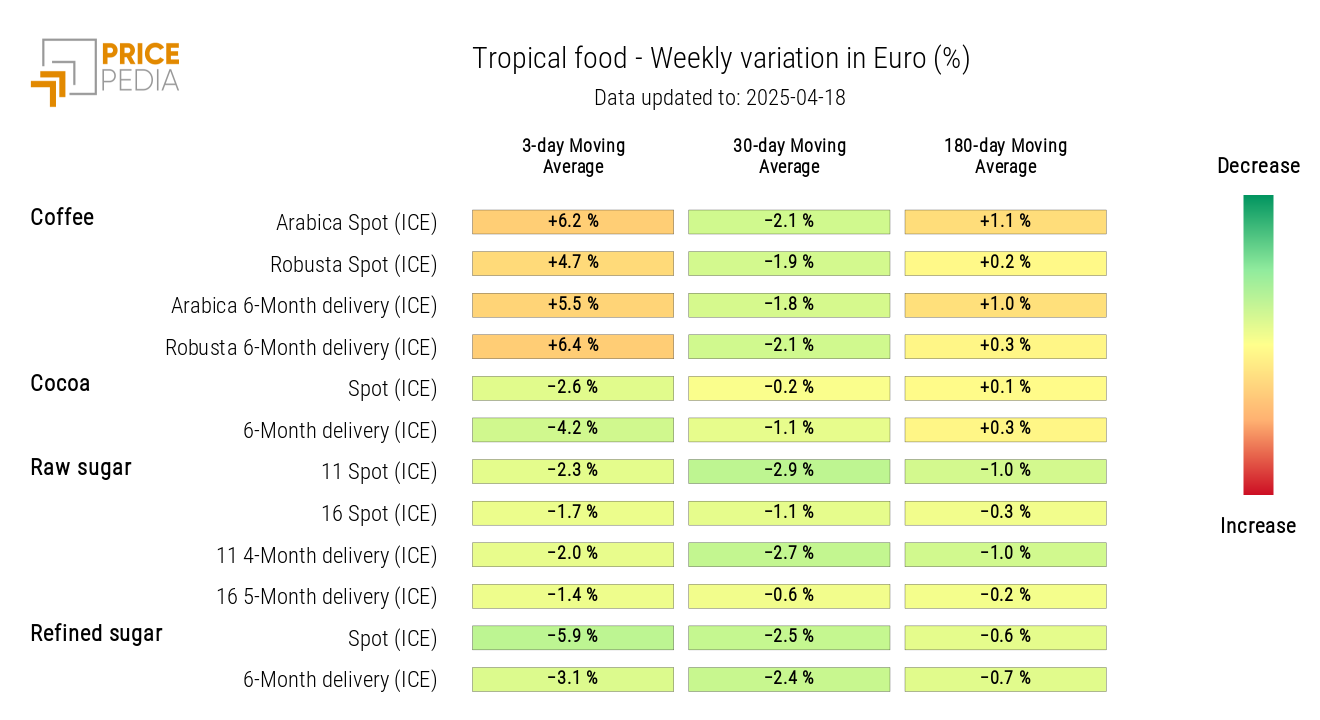
The tropical heatmap shows a new significant increase in coffee prices, alongside a decrease in those of sugar and cocoa.
HeatMap of Tropical Food Prices in Euro
OILS
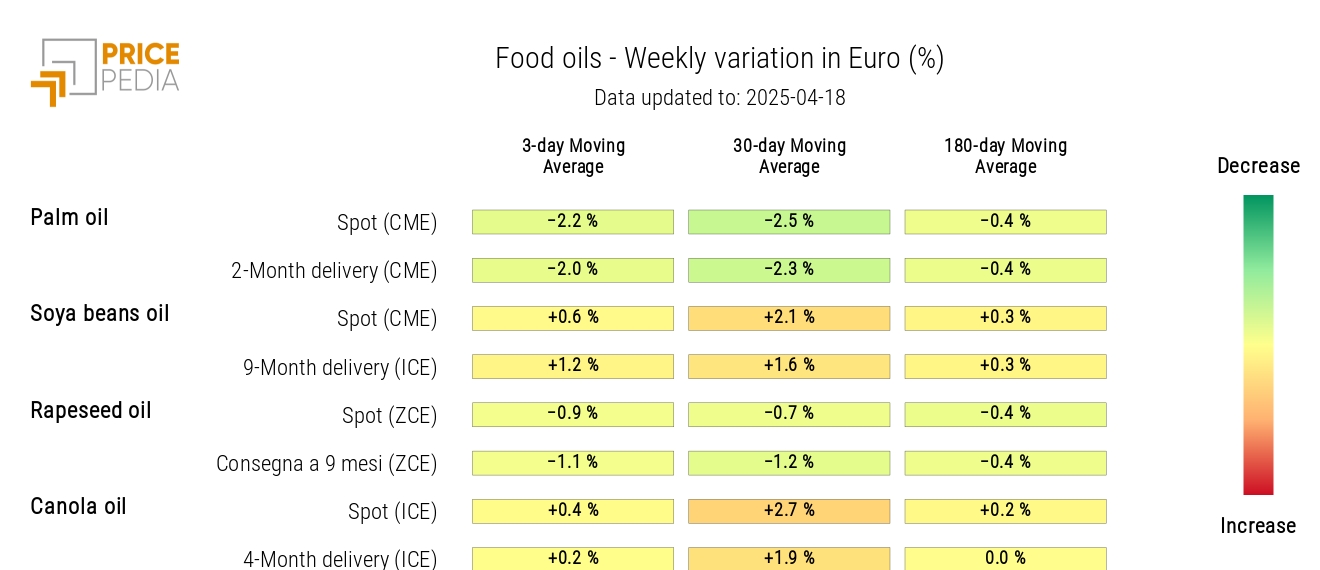
The edible oils heatmap indicates a slight decrease in the weekly moving average price of palm oil.
HeatMap of Edible Oil Prices in Euro
