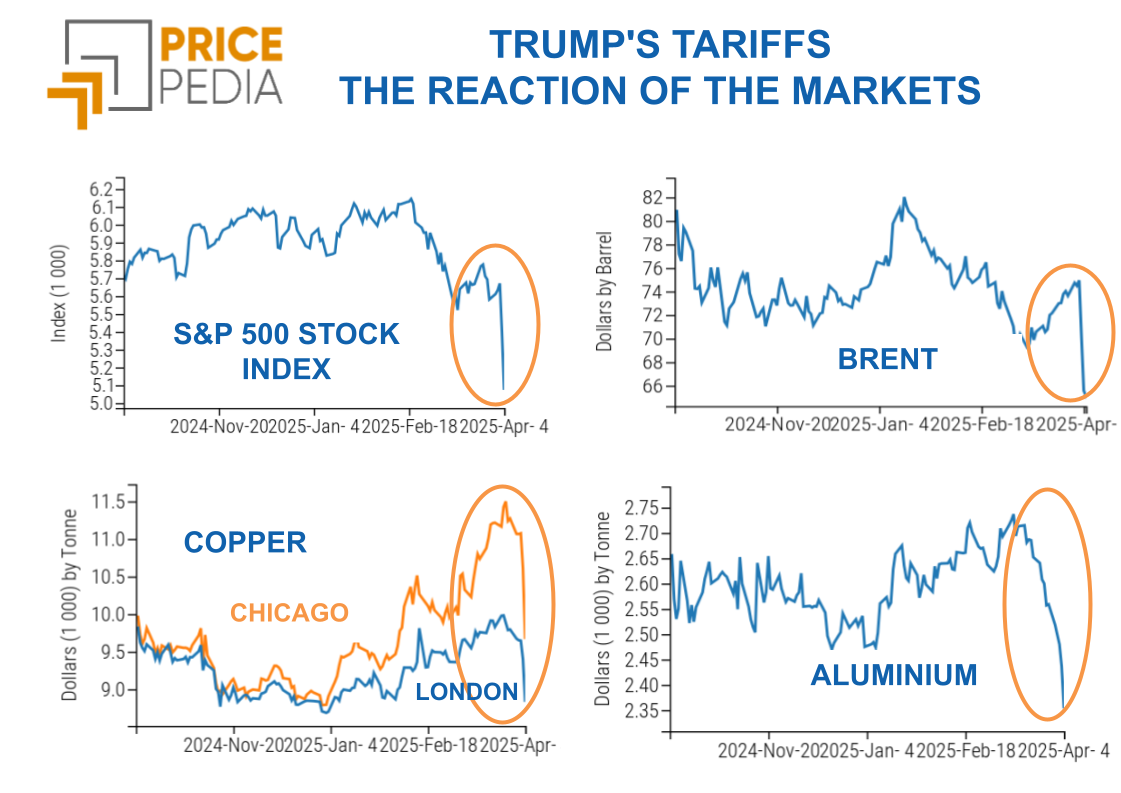
Commodity prices incorporate the effects of Trump's trade war
Week of relative calm in financial commodity markets
Published by Luigi Bidoia. .
Conjunctural Indicators Commodities Financial WeekWeekly Summary of Financial Commodity Prices
After last week's pause in Trump’s trade policies, financial markets experienced a phase of relative calm this week. The dollar exchange rate stabilized at a value close to 1.14 dollars per euro. The spread between 10-year interest rates on U.S. Treasuries and German Bunds remained below the 2.0% threshold. U.S. stock indices partially recovered the losses suffered in the first 15 days of the month, thanks to signs of de-escalation in U.S. trade policy. The Trump administration acknowledged that the current level of tariffs on U.S. imports from China (+145%) is unsustainable, suggesting a willingness to reach an agreement involving lower tariffs, around 50%.
Commodity financial markets also experienced relative calm, as shown in the PricePedia index chart of financial commodity market volatility below.
PricePedia Index of Financial Commodity Market Volatility

After peaking following the reciprocal tariffs introduced by the Trump administration on April 2nd against most partner countries, commodity market volatility gradually declined, reaching by the end of this week one of the lowest levels of the past five years.
This price stabilization is driven by various dynamics. On one hand, energy prices remain weak, while on the other, industrial commodities (metals and plastics) show greater resilience, and food commodity prices are slightly increasing. During April, energy prices declined by an average of -13% in dollar terms, industrial commodities by -4%, while food commodities saw a slight increase.
Monetary Policy and Economic Outlook
Business surveys released this week confirmed the weakness in economic activity levels in the U.S. economy.
This fragility is accompanied by rising inflation expectations, fueled by the high tariffs imposed on U.S. imports. In this context, the U.S. central bank (Federal Reserve, FED) appears increasingly concerned about the inflationary risks stemming from trade policy. It is therefore unlikely that U.S. interest rates will be reduced before the end of 2025.
Conversely, the European Central Bank (ECB) is expected to lower its policy rate to 2%, thereby increasing the spread with the U.S. rate beyond 2%. Inflation in the Eurozone is slowing down, a trend that may accelerate in the coming months thanks to declining energy prices and the strengthening of the euro. Furthermore, economic activity levels in the EU are expected to remain weak due to the expected slowdown—or even contraction—in global trade.
Recent signs of recovery in industrial activity recorded in some EU countries are primarily attributable to anticipated shipments to the United States aimed at avoiding upcoming tariffs.
NUMERICAL APPENDIX
ENERGY
After last week's recovery, the PricePedia financial index of energy products returned by the end of this week to levels close to the 2025 minimum.
PricePedia Financial Index of Energy Prices in Dollars

The PricePedia energy heatmap shows a drop in oil prices, with Brent remaining below $70/barrel, and more notably, a decline in gas prices across all major global regions. In particular, the gas price at the Dutch TTF hub fell to 32 euros/MWh. In this context, Italy’s single electricity price dropped to 70 euros/MWh, returning to levels seen last spring.
HeatMap of Energy Prices in Euro

PLASTICS
The financial index of plastics and elastomers, in line with the decline in the energy price index, showed a downward trend.
PricePedia Financial Indices of Plastics Prices in Dollars

The weekly changes in the 3-day moving averages of plastics and elastomer prices remain negative, but show significantly smaller declines compared to those seen in the 30-day moving average.
HeatMap of Plastics and Elastomer Prices in Euro

FERROUS METALS
The two indices of ferrous metals continue to diverge, although the European index experienced a sharp price decline in the final days of the week.
PricePedia Financial Indices of Ferrous Metal Prices in Dollars

The ferrous metals heatmap shows a significant weekly reduction in the 3-day moving average of prices only for steel scrap and steel rebar in the Turkish market.
HeatMap of Ferrous Metal Prices in Euro

Do you want to stay up-to-date on commodity market trends?
Sign up for PricePedia newsletter: it's free!
NON-FERROUS INDUSTRIAL METALS
The recovery of financial indices for non-ferrous metals, which began following the 90-day suspension of reciprocal US tariffs, continued this week.
PricePedia Financial Indices of Non-Ferrous Industrial Metal Prices in US Dollars

The non-ferrous heatmap shows an almost generalized increase in the prices of various metals. The most significant increase was recorded by copper, which in the middle of the week exceeded 9,400 dollars per ton.
HeatMap of Non-Ferrous Metal Prices in Euros

FOOD
The upward trend of the tropical commodities index continued this week. In contrast, the direction of the cereal and oil indices remains uncertain.
PricePedia Financial Indices of Food Commodity Prices in US Dollars

CEREALS
The cereal heatmap indicates a slight recovery in oat prices and a decline in spot prices of corn, rough rice, wheat, and soybean meal.
HeatMap of Cereal Prices in Euros

TROPICALS
The tropical commodities heatmap highlights a further significant increase in the prices of Arabica coffee and, above all, cocoa.
HeatMap of Tropical Food Commodity Prices in Euros

OILS
The heatmap of edible oils shows a slight increase in weekly moving average prices, generalized across all oils.
HeatMap of Edible Oil Prices in Euros

You may be interested in:

Transfer of US-China tensions from trade to financial flows
Published by Luca Sazzini. .
Conjunctural Indicators Commodities Financial WeekMarkets under stress: how Trump's tariffs affect financial price fluctuations [ Read all ]
Liberation or Ruination Day? A storm of tariffs on commodity markets
Published by Luca Sazzini. .
Conjunctural Indicators Commodities Financial WeekFinancial markets fail U.S. protectionist policy [ Read all ]

Commodities in check since Trump's annnucials
Published by Luca Sazzini. .
Conjunctural Indicators Commodities Financial WeekFaced with uncertainty, investors find refuge in gold [ Read all ]